After reporting its Q2'24 earnings on August 6, 2024, Airbnb's share price dropped by more than 13%. With the current price hovering around $115, we wanted to briefly review its latest earnings report, analyze key performance indicators (KPIs) compared to peers, and update our valuation to determine if the stock is indeed attractive.
But before that, let us share some thoughts on insider actions and comments…
1. Insiders
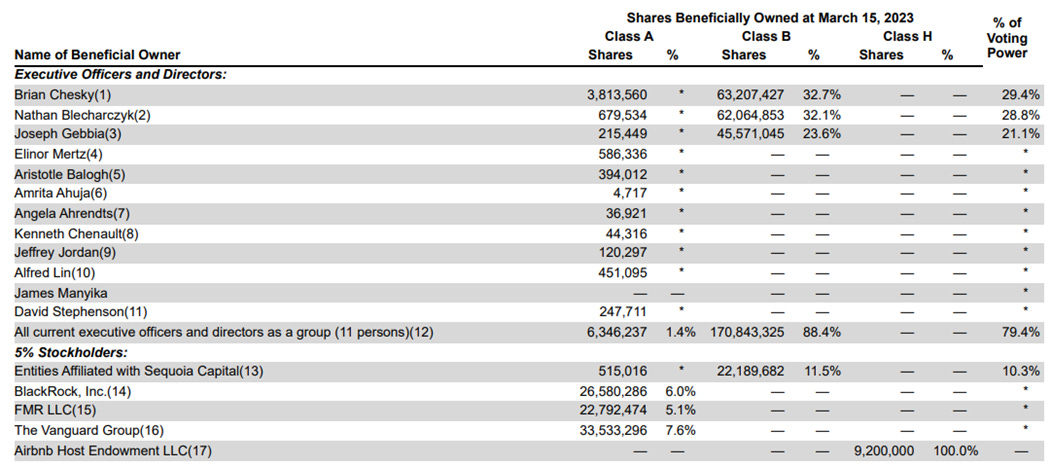
When insiders publicly state that a stock is attractive (screenshot below), investors typically take notice. However, it's concerning that Chesky deleted his post just hours after being asked if insiders are buying shares. We double-checked ABNB - SEC Form 4 Insider Trading Screener - OpenInsider and found no open-market insider purchases in at least the past year, but plenty of sales.
Regarding Chesky's sales, we understand the need to sell shares, given that his total annual salary is just $1 with no cash bonus. But rest assured, Chesky has ample funds, having sold shares worth about $159.3 million in 2023 and, as of July 24, 2024, has sold shares worth about $209.4 million this year.
Despite these concerning signs, insider ownership and voting power remain significant.
Source: Annual proxy 2023, Note: Wrong date in table – this is 15th March 2024
Without further ado, let's dive into the company's quarterly performance.
2. Key Results
Overview
Source: Quartr (20% discount for StockOpine readers if you apply STOCKOPINE20 coupon at checkout)
ABNB 0.00%↑ reported revenues of $2.75B, representing a YoY increase of 11%, beating consensus and the upper end of its guidance of $2.74B. The growth rate is higher than Expedia’s growth of 6% and Booking’s growth of 7.3%.
Adjusted EBITDA margin dropped from 33% in Q2'23 to 32.5%, primarily due to the timing of marketing expenses.
Income from operations was $497M, down from $523M in the prior year, reflecting a ~300bps decline in EBIT margin (18.1% in Q2'24), impacted by the lower EBITDA margin and a 26% increase in SBC costs (13.9% of revenue vs. 12.2% in Q2'23).
Net income was $555M, a decrease of 14.6% from $650M in Q2'23, mainly due to higher taxes (effective rate of 18.5% vs. 3.8% last year due to the release of a valuation allowance), causing the net income margin to drop from 26.2% to 20.2%.
GAAP EPS was $0.86, compared to an estimated $0.95 and $0.98 in the prior year.
Strong Balance Sheet: Cash, cash equivalents, and marketable securities totaled $11.3B, compared to total debt of $2.0B.
$1.0B in Free Cash Flow (FCF), up $143M from Q2'23, resulting in a trailing twelve-month (TTM) FCF of $4.3B, with margins of 38% for the quarter and 41% on a TTM basis.
KPIs
Source: Airbnb 10-Q reports, Airbnb Shareholder letters, StockOpine analysis
GBV of $21.2B, an increase of 11% YoY, driven by a 9% increase in Nights and Experiences from Q2'23, while ADR improved marginally by 2% due to mix and price increases.
In comparison, Booking's GBV


