

In this report we will examine Autodesk as a potential candidate to our portfolio. The recent pullback in the Company’s stock price, its long history, its leadership position in the Computer Aided Design (CAD) as well as the high switching costs associated with its solutions is what attracted us to the Company in the first place.
The structure of the report will be as follows:
1. The stock
2. Company Profile
3. Business Overview
4. Industry and competition
5. Financial analysis
6. Management
7. Opportunities, Risks and Competitive advantages
8. Valuation
1. The stock
Ticker: $ADSK
Market cap: $41.13 Billion
Price: $193.22
Stock performance: Year to date: -31.3%, 1 Year: -33.8%, 5 Year: 106.8%
52 Week range: $180 - $ 344
EV/Sales: 9.7
EV/EBITDA: 51.3
P/E: 86.1
*Note: The above data is as of 3/5/2022
2. Company Profile
Autodesk (the “Company”) provides software solutions for the architecture, engineering, construction, product design, manufacturing, media, and entertainment industries. The Company’s solutions focus amongst others on Computer Aided Design (CAD), Building Information Modelling (BIM) and 3D Modelling.
The Company’s flagship product is AutoCAD, computer-aided design (CAD) software with its first release in 1982 when the Company was founded.
CAD is used in various industries and is basically the use of computer software to design 2D and 3D digital representations of objects. CAD is used by engineers, manufacturers, architects, and other designers. The flagship product of Autodesk, i.e., AutoCAD (top right in the below Grid) is recognized as the leader in general purpose CAD software as per G2 Grid.
In addition to AutoCAD as a standalone product, the Company’s solutions serve the below three industries:
Architecture, Engineering & Construction (AEC)
Product Design & Manufacturing
Media & Entertainment
AEC
Software solutions in AEC include amongst other AutoCAD and Revit (Company’s BIM solution) which are characterized by many as the industry standard in Architecture and Engineering. Hence, both solutions are recognized as leaders in G2 Grid for Building Design and Building Information Modeling (BIM).
The last few years the Company is looking to capitalize on its leadership in the design part of the AEC by developing and acquiring solutions around construction project management. In early 2021, Autodesk Construction Cloud was launched, a collection of Autodesk applications which connects workflows, teams and data at every stage of construction. Autodesk Construction Cloud is recognized as one of the leaders in G2 Grid for Construction Project Management Software. While Autodesk Construction Cloud is not a significant contributor to revenue, it had its best quarter and accelerating growth in the fourth quarter of fiscal 2022, entering FY '23 with strong momentum.
Manufacturing
In manufacturing, the Company sees a significant market opportunity with its solution Fusion 360 gaining momentum and growing by 53%, 3-year CAGR up to Q2’2022. Below is a chart extracted from 2021 Investors’ Day exhibiting management’s expectations for future incremental revenue growth indicating a significant acceleration in the manufacturing segment.

Media & Entertainment
Media & Entertainment solutions consist of 3D Modelling and 3D rendering software like 3Ds Max Design and Maya. Both are recognized as leaders in G2 Grid scoring, only behind Unity’s software. Autodesk’s collection enables animators, modelers, and visual effects artists to create compelling effects, 3D characters, and digital worlds. Even though, this segment is not a significant revenue contributor, we might be hitting an inflection point here, as it can place Autodesk’s M&E solutions deeply in the world of virtual worlds.
Revenue by Segment
Total Revenue for fiscal year 2022 was $4.4 billion, up 16% from prior year. In its financial statements, the Company’s revenue is reported into five segments (AEC, AutoCAD, Manufacturing, Media & Entertainment and Other). AEC and AutoCAD make 73% of revenue for fiscal year 2022, similar to 2021 (72%).

The Company except the by Product Family it also breaks its revenue by Product Type such as Design, Make and other, with Design accounting for 88% of revenue ($3,869 million) while Make accounts for 8% ($364 million). It is worth noting that the Design part grew at a CAGR of 15% from fiscal year 2020 to fiscal year 2022 while the Make part grew by 29%. While the Design part contains the flagship products such as AutoCAD, Revit, Inventor, Maya and 3Ds Max, the Make part is where management sees significant opportunities with its Fusion 360 and construction cloud solutions (manufacturing segment and construction solutions).
Management claims that its total addressable market (TAM) is $62B in 2022 and is expected to grow to $78B in 2026 (CAGR of 5.9%) of which $43B comes from Design and $35B from Make business. Breaking down FY 2026 TAM by segment, management claims a TAM of ~$36B in AEC, ~$38B in product development and manufacturing and ~$5B in Media and Entertainment.
3. Business Overview
Sales
The Company transformed its business model from selling perpetual licenses to selling subscriptions (SaaS model) by discontinuing selling new perpetual licenses during 2016. During the business model transition, revenue was negatively impacted as more revenue was recognized ratably rather than upfront. The transition to subscriptions adds stability to the business model making it more robust to economic headwinds. The Company is offering annual subscriptions as well as multiyear subscriptions. With multiyear subscriptions clients are paying in advance realizing discounts offered by the Company. In addition to subscriptions, the Company is also offering a Pay as you go program (Autodesk Flex). In Flex, clients are purchasing tokens and assign users to the Flex program and those users consume the tokens through the use of the software. While subscriptions are suited best for frequent users, Flex is best for occasional users.

As of the end of fiscal year 2022, the number of subscriptions totalled 6.04 million, up 14.5% from fiscal year 2021. As of Q4’2022, the Company generated 93% of its revenue through subscriptions while 94% of its total revenue is considered recurring.
Company’s revenue is distributed globally with 40% coming from Americas, 39% from EMEA (Europe, Middle East, and Africa) and 21% from Asia Pacific as per Q4’2022.
Sale channels
The Company sells its solutions to customers both directly and through a network of resellers (one-tiered structure) and distributors (two-tiered structure). The adoption of cloud solutions and the subscription-based model in the past years lead to a shift towards direct sales which is more favourable to the Company in terms of profit margins. Direct sales in Q4 2020 were 31% of total sales while in Q4’2022 direct sales were 38% of total sales. Total direct sales for Fiscal 2022 accounted for 35%.
Direct sales consist of sales where Autodesk transacted directly with enterprise and named account customers as well as sales through Autodesk’s online store. Online sales are the fastest growing sales channel for the Company.
Debbie Clifford, CFO at Q3’2022 “about three quarters of new customers to Autodesk are now generated through our digital channels, reflecting the strength of our simplified buying experiences.”
Indirect channel model includes both a two-tiered distribution structure, where distributors sell to resellers, and a one-tiered structure, where Autodesk sells directly to resellers.
Autodesk anticipates that the channel mix will continue to change, particularly as they scale the online Autodesk branded store business and Autodesk’s largest accounts shift towards direct-only business models. However, it is expected that the majority of the revenue will continue to be derived from indirect sales channel in the near future.
In terms of concentration risk, the two largest distributors account for 45% of the Company’s total net revenue for fiscal 2022. Despite this, as indicated in the 10K report of fiscal 2022 “Should any of the agreements between us and Tech Data or Ingram Micro be terminated for any reason, we believe the resellers and end users who currently purchase our products through Tech Data or Ingram Micro would be able to continue to do so under substantially the same terms from one of our many other distributors without substantial disruption to our revenue”.
Education
Autodesk is also offering free educational licenses of Autodesk’s software to students, educators, and accredited educational institutions worldwide. Establishing those relationship and getting students trained on the software creates a familiarity with the product, making it easier to onboard those potential consumers once they start their professional career.
Non-compliant users
Management claims to have 15 million non-compliant users which use the product actively and have the potential to be monetized. Unauthorized use of the Company’s solutions is believed to have impacted the Company’s revenues in the past. We believe that the transition from perpetual use software licenses to a subscription-based business model combined with the transition from multi-user subscriptions to named users will allow the Company to monetize a number of non-compliant users driving further revenue growth.
Margins and Cost structure
The Company’s Gross profit margin profile is in the high range of SaaS Companies with fiscal 2022 being 91.68% and has been trending upwards since the Company’s business model transition. For example, GPM in fiscal 2017 was 85.14%.
Most expenses are employee related costs, similar to other SaaS companies. This is an asset light business with minimal CAPEX requirements but with heavy investments in R&D. The average R&D spent for the last ten years was 29% of revenue (25% for fiscal year 2022).
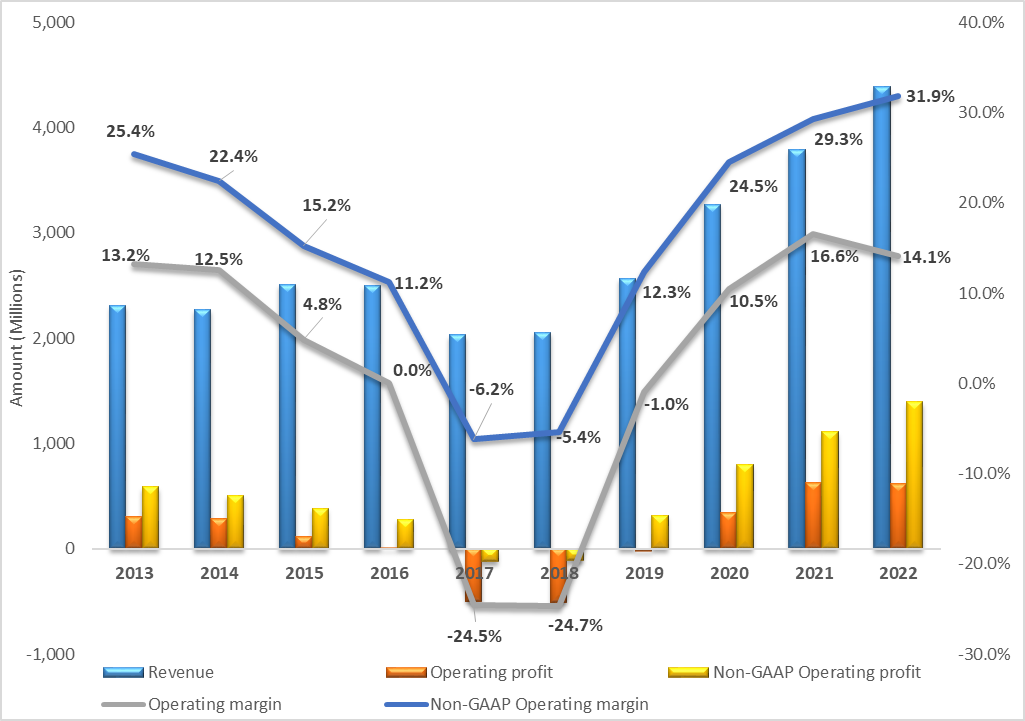
Software companies like Autodesk are exhibiting high operating leverage due to the high amount of fixed costs, giving room to expand operating margins as they scale up. The below line graph displays the strength of its operating leverage since the Company’s business model transition.

Management expects non-GAAP operating margins to expand to 37% in fiscal 2023 with a mid-term goal in the range of 38%-40% beyond fiscal year 2023. During the Investor Day 2021, in a question whether 38%-40% is the ceiling for the non-GAAP operating margins, the CEO replied that they see themselves as a growth company and they will continue investing to drive revenue growth and that optimizing operating margins is not their first priority in the mid-term, implying that further expansion is possible once the business enters its mature phase.
The below line graph shows a downward trend in operating expenses as a % of revenue and depicts where the operating leverage is coming from. Marketing and sales have been trending downwards since 2018, and we expect this trend to continue as sales are shifting towards direct channels. R&D % is declining as well, with management expecting a further decrease as a % of revenue in fiscal 2023.

* The figures in the above graph are GAAP and thus, do not reconcile to the graph of non-GAAP operating margins. The key difference in GAAP and non-GAAP metrics is the Share based compensation (13% in fiscal 2022), depreciation/amortization and other non-recurring expenses.
Capital allocation
The Company invests its operating cash flows in share repurchases and acquisitions.
1. Acquisitions
The largest acquisitions in the last years were the acquisition of Innovyze Inc in March 2021 for $1 billion and the acquisition of PlanGrid in December 2018 for $875 million.
PlanGrid - a construction productivity software focused on document centric workflows for field execution and project management was acquired for $875 million. Autodesk acquired PlanGrid as part of their strategy to develop their construction suite of solutions. PlanGrid contributed in excess of $100 million in ARR in fiscal 2020 and was later migrated to Autodesk Build (part of construction cloud) which was released in 2021 and creates a comprehensive suite of field construction and project management solutions.
Innovyze Inc - a global leader in water infrastructure simulation and modelling. Innovyze acquisition complements Autodesk’s infrastructure solutions and positions the Company as a leading global provider of end-to-end digital solutions from design to operations of water infrastructure. At the time of acquisition, management expected Innozyze to be accretive to revenue growth, broadly neutral to free cash flow and a headwind on reported operating margins in fiscal 2022 and 2023. During the Investor Day 2021, management highlighted that the acquisition of Innovyze increased its TAM in water infrastructure from $0.7billion to $2.6 billion.
2. Share repurchase program
The share repurchase program in place allows for the repurchase of shares to offset the dilution from Share Based Compensation (SBC) as well as reducing the shares outstanding over time. The Company purchased $1.27 billion worth of common stock for fiscal 2022 (4.0 million shares) and $708 million during fiscal 2021 (2.6 million shares). At January 31, 2022, 8.1 million shares remained available for repurchase under the repurchase program, which does not have an expiration date.
In Q4 2022 alone, the Company purchased 2.3 million shares for $613 million at an average price of approximately $267 per share. Given the recent pullback, we shall expect accelerated buyback in fiscal 2023.
Debbie Clifford, CFO “You'll see us continue to be opportunistic with share buybacks, but our capital allocation strategy is unchanged.”
Overall, we observe a downward trend in the number of shares outstanding which declined from 227 million in 2015 to 218.2 million in 2022.
4. Industry and competition
Industry
The industry is generally fragmented due to its low barriers of entry and is characterized by vigorous competition in each of the vertical markets that CAD software is deployed. The availability of computing power with continually expanding performance at lower prices contributes to the ease of market entry.
The global 3D CAD software market size was valued at USD 9.5 billion in 2020 and is expected to register a compound annual growth rate (CAGR) of 6.4% from 2021 to 2028 reaching USD 15.4 billion.
Cambashi estimates that $14bn was spent on BIM software in 2021 and forecasts the BIM software market to continue with double digit growth CAGR of 12%, reaching $21bn by 2025.
Growth in CAD software market is driven by robust demand from the automotive industry, increase in additive manufacturing and growing adoption of cloud-based CAD software. Currently, the majority of the CAD solutions are deployed on-premise, however, demand for cloud-based solutions is increasing due to the increase in computing power, ease of installation process and collaboration features which further drive growth in the space.
Growth in BIM, is driven by the increase in construction activities and is further reinforced by the rise in government mandates for BIM usage.
Additionally, the emergence of VR and AR technologies further provide use cases for CAD, BIM and 3D modelling software since it enables users to see how their designs will work in the real world. BIM integration with AR and VR allows for better collaboration among stakeholders in the construction space. Adoption of VR/AR will further drive growth in 3D modelling and rendering software as media houses and game developers need to facilitate the design and virtualization of digital worlds, characters and animations.
Competition
In assessing the competitive landscape we identified the key players in the industry and obtained a high level understanding of the verticals they operate as well as their scale compared to Autodesk.


*Note: The above data is as of 3/5/2022
As it can be observed from the above graph Autodesk along with Dassault Systems SE are the largest players in the industry in terms of revenue and market capitalization. Autodesk grew revenues at a 5 year CAGR of 16.7% which the highest 5 year growth rate amongst its peers.
On the other hand, EBITDA Margin of 18.8% is well below the average of its peers of 24.1% (excl. Procore). However, the expectation to reach a non-GAAP operating margin of 37% in Fiscal 2023 Vs 31.9% in Fiscal 2022 is a favourable sign.
5. Financial analysis
The Company has consistently grown its revenues, from $2.06 billion in 2018 to $4.39 billion in fiscal 2022, CAGR of 20.8%. This is partly explained by the shift to subscriptions model, the increase in subscription renewal rates, new product subscriptions and acquisitions. As per the latest guidance, revenue for FY’23 is expected to increase by 15.5% to $5.07 billion (using the mid-point of the guidance).
Total billings increased by 16% to $4.82 billion in FY’22, with management expecting total billings for FY’23 in the range of $5.9 - $6 billion, up 22% - 25%.
Net revenue retention rate was within the range of 100% and 110% as of both January 31, 2022 and 2021. Net revenue retention measures the year-over-year change in revenue for customers that existed one year ago. Revenue retention above 100%, indicates that existing customers are spending more with the Company either through subscribing to additional solutions or through increases in price of the Company’s solutions.
The Company grew its operating income from an operating loss of $509 million in 2018 to an operating profit of $618 million in FY’2022. However, both fiscal years include non-recurring expenses. If we adjust for the restructuring expenses and CEO transition expenses in 2018 as well as lease related impairment and acquisition costs incurred in fiscal 2022, we get an operating loss of $393 million in fiscal 2018 and an operating profit of $747 million for FY’22, implying an adjusted operating margin of 17% compared to unadjusted margin of 14.1%.
For FY’2022, the Company reported non-GAAP operating profit of $1.4 billion, and a non-GAAP operating margin of 31.9%, whereas for FY’2023, management guided for non-GAAP operating margin of 37%. Assuming a revenue of $5.07 billion, it translates to a non-GAAP operating income of $1.88 billion, an increase of 34.2%. As per management the GAAP operating margin is expected to be c.21%. Beyond fiscal 2023, management expects to continue targeting double-digit revenue growth, non-GAAP operating margins in the 38% to 40% range and double-digit free cash flow growth.
GAAP diluted earnings per share for FY’22 was $2.24, including a $0.47 negative impact of lease related charges, compared to $5.44 in FY’21, including a $3.06 positive impact of a deferred tax asset valuation allowance release. Adjusting for the impact of lease related charges in the current year and deferred tax asset valuation allowance, the diluted EPS for FY’22 would have been $2.71 compared to $2.38 in FY’21 representing an increase of 13.9%. For FY’23, management expects GAAP EPS of $3.93 (mid-point), an increase of 44.8%.
Cash position and cash generation
Cash, cash equivalents, and marketable securities amount to $1.81 billion as of 31 January 2022, whereas total debt was $2.63 billion.
Autodesk generated $1.53 billion cash flow from operations in FY’22, up 6.3% compared to FY’21 and Free cash flow of $1.48 billion for FY’22 compared to $1.35 billion in FY’21. During the last 3 years the average FCF/Revenue was 37%. For fiscal 2022, management expects free cash flow to be between $2.13 billion and $2.21 billion i.e., 42.8% FCF margin (taking the midpoint of the guidance). The 42.8% is not necessarily recurring as multi-year contracts distort FCF margins.
We should also mention that management was previously targeting FY 2023 FCF of $2.4 billion and non-GAAP margin of 38%. This is a target miss of approximately $200 million (or 8.3%) on FCF and 1 percentage point on Non-GAAP margin based on management’s latest guidance. Management blamed supply chain issues, labor shortages, COVID and fx headwinds for the miss.
As we move into FY’24 the Company is planning to shift from multi-year contracts to annual billings. This will make free cash flow more consistent and revenue stream more predictable, while it could also result in higher price realization since it will reduce the discounts offered for multi-year contracts. As a result of the above transition, management highlighted that it will take a hit on FCF in fiscal 2024 but FCF growth will accelerate in FY’25 and FY’26. Overall, management expects double digit growth from FY’23 to FY’26.
6. Culture & Leadership
Based on Glassdoor rating, 88% of the employees would recommend the Company to a friend and the approval rate of the CEO is at 93%. The high % in both metrics gives an indication that there are not any major culture issues within the Company. In comparison, Dassault Systemes overall scoring is 3.7 and scores 73% and 93% for “Recommend to a Friend” and “Approve of CEO”, respectively.

Andrew Anagnost (CEO) joined Autodesk in September 1997 and has served as President and Chief Executive Officer since June 2017. Until recently, the CEO’s tenure was complemented with annual returns for the shareholder in excess of the market (106.8% Vs 74% of S&P 500 as of 3/5/2022).
Deborah L. Clifford (CFO) joined Autodesk as Executive Vice President and Chief Financial Officer in March 2021. Ms. Clifford previously served as Chief Financial Officer of SVMK Inc. (“SurveyMonkey”), an online survey software company since July 2019. Prior to joining SurveyMonkey, Ms. Clifford served as Vice President of Financial Planning and Analysis at Autodesk from January 2018 to July 2019 and had served in various finance positions at Autodesk since September 2005. She was also an instrumental player in the company’s transition from a perpetual to subscription business model.
7. Opportunities, Risks and Competitive advantages
Opportunities:
Management claims to have 15 million non-compliant users which use the product actively and have the potential to be monetized. At one point many of those users will have to subscribe to keep up with the updates and new features offered.
Andrew Anagnost (CEO),at the Credit Suisse conference “there’s about 15 million out there that are actively using the product that are available to us. We don't expect to ever capture all of those. But you know, even if we capture 10%, 15%, 20% of that, that's a lot of users to capture over the next several years”.
The construction industry is at the early innings of digitization giving the Company enough runway to continue growing revenue at double digits. Construction industry is accelerating demand for BIM (Building Information Modeling) software due to remote work trends and government initiatives and mandates that are driving digital transformation in the industry.
According to Cambashi’s research paper on BIM, the construction sector has low digital penetration and the digital adoption within construction concentrates within Design, thus leaving Construct and Operate phases largely unpenetrated. Autodesk with its construction cloud and Revit (BIM) is at the right spot to penetrate the Construct and Operate phases.
Cambashi estimates that $14bn was spent on BIM software in 2021 and forecasts the BIM software market to continue with double digit growth CAGR of 12%, reaching $21bn by 2025.
$1 trillion Infrastructure bill passed in 2021 will be a tailwind for Autodesk. Increase of construction and infrastructure projects in US, suggests a relative increase in demand of AEC business solutions.
Autodesk’s Senior Director of Infrastructure Industry & Business Strategy at Barclays conference regarding the bill, “There is an uplift of $373 billion. So, if I look at – actually deconstruct by all the sub-segments, roads and bridges, rail, water infrastructure, water storage, transit, there's about $373 billion worth of opportunity that we directly have products and offerings that service those sub-segments”.
Metaverse/AR/VR: This is more of a long shot opportunity but still Autodesk might benefit from the use of its 3D modelling software for the design of digital worlds, characters etc. In addition, on 24th March 2022 Autodesk signed a definitive agreement to Acquire The Wild, Extended Reality (XR) Solutions Provider for Immersive and Collaborative workspaces for Design and Construction. This acquisition enables Autodesk to meet increasing needs for augmented reality (AR) and virtual reality (VR) technology advancements within the AEC industry and further support AEC customers throughout the project delivery lifecycle.
Competitive advantages:
High switching cost – Existing customers trained on Autodesk’s solutions will be reluctant to switch to alternatives due to familiarity with the product as well as the financial cost of deploying and training on a new software. Company’s solutions are significant in the processes and workflows of its customers, increasing dependency, and giving the Company pricing power.
Existing Installed base - Within the construction industry, Autodesk is a leader in the design with the majority of the companies using its design tools, whether it's AutoCAD, Revit or Civil 3D, thus giving the ability to the Company to expand through new offerings like its construction cloud. Its large installed base gives the company an additional advantage since it will not have to acquire those customers and its focus will be on expanding within those customers with new solutions or additional subscriptions. The net revenue retention rate above 100% demonstrates this strength.
Risks:
High valuation for a company which is expected to grow revenues at 15%, trading at EV/Sales multiple of 10x and next year’s P/E of 46.
The Company engages often in acquisitions. Inorganic growth might lead to wrong allocation of capital resulting to significant write-offs of goodwill destroying shareholder value. Currently, the Company has $3.6 billion goodwill and $0.5 intangibles on its balance sheet.
Current economic environment including supply chain disruption and inflation pressures can negatively affect the industries which the company operates (i.e., construction) which in turn can take a hit on demand for Autodesk’s solutions. For example, planned construction projects of Autodesk’s customers might be postponed, withdrawn or not finish as quickly as they expected in order to start new projects.
Significant portion of revenues is generated from international operations, thus changes in the value of the U.S. dollar may have a significant effect on net revenue, total spend, and income from operations in future periods. Hedging program exists but does not attempt to fully mitigate the impact from FX fluctuations.
Concentration risk in indirect channel – Top 2 distributors accounted for 45% of revenue in fiscal 2022. Should those distributors face any financial or operational difficulties it can impact Autodesk’s business and revenue in the short-term.
8. Valuation

*Note: The table above is as of 3/5/2022
As per the above table, Autodesk’s EV/Sales multiple is well below the 5-year average and it stands at the low-range relative to its peers and other SaaS companies, despite the revenue growth expected for the next twelve months (15.4%) which is in the range of the past 5 year revenue growth (16.6%). Management also expects to continue growing revenues at double digits in the next 3 – 5 years.
The Company’s profitability multiple (EV/EBITDA) stands at the high range relative to its peers. We believe that the trailing twelve month EV/EBITDA multiple (51.3x) is not a fair assessment of the Company’s valuation, since operating margins have not yet been optimized; with the Company investing for further growth since its business model transition and improving its operating margins since 2017. Non-GAAP operating profit margin increased from -6.2% in 2017 to 31.9% in FY’2022 and management expects further expansion to 37% in FY’2023.
Despite the recent drop in price and multiples of Autodesk, we believe that it is unlikely to observe a multiple expansion any time soon given the current economic environment, unless the Company demonstrates a higher-than-expected growth and/or improvement in margins.
Expected IRR

Analysts are expecting Autodesk to grow revenues to $7.29 billion by fiscal 2026, CAGR of 13.5%. Expectations seem reasonable given that management targets double digit revenue growth up to FY’26. Management guidance for non-GAAP operating margin in FY’23 is 37% with its mid-term goal (FY’24 to FY’26) in the range of 38%-40%. Assuming that non-GAAP operating margin for FY’26 is 40% and deducting the share-based compensation of 11.4% (three-year average), the EBITDA margin for fiscal 2026 is 28.6%. The resulting EBITDA margin of 28.6% appears reasonable taking into consideration the current EBITDA margin of its peers (Dassault, Nemetschek and PTC).
Assigning an EV/EBITDA multiple of 25 to the resulting EBITDA of $2.08 billion implies an Enterprise Value of $52.1 billion in FY’2026 and an IRR of 4.7% based on the current share price, ignoring any buyback yield.
Conclusion:
There is a lot to like about Autodesk, however in our opinion the current share price does not provide potential for outsized returns. We will not be buyers here, but we will follow the business closely and we might initiate a position if there is further drawdown from current levels. We understand that the share price might go higher from here and we might miss a potential compounder, however we believe that the current price does not provide sufficient margin of safety.
The level of share based compensation is outrageous. This company is run for the benefit of employees (who are ongoing sellers of shares ) not shareholders who pay via dilution.