
AWS Acceleration and Custom Silicon Drive Record Margins
Is the Market Mispricing Amazon's Integrated AI Growth?

This was a record-breaking quarter, marked by the highest operating margin in the company’s history and a massive acceleration in AWS growth. Let’s have a look at their Q1 2026 performance and see if these developments justify Amazon’s stock price.
1. Performance
a. Results
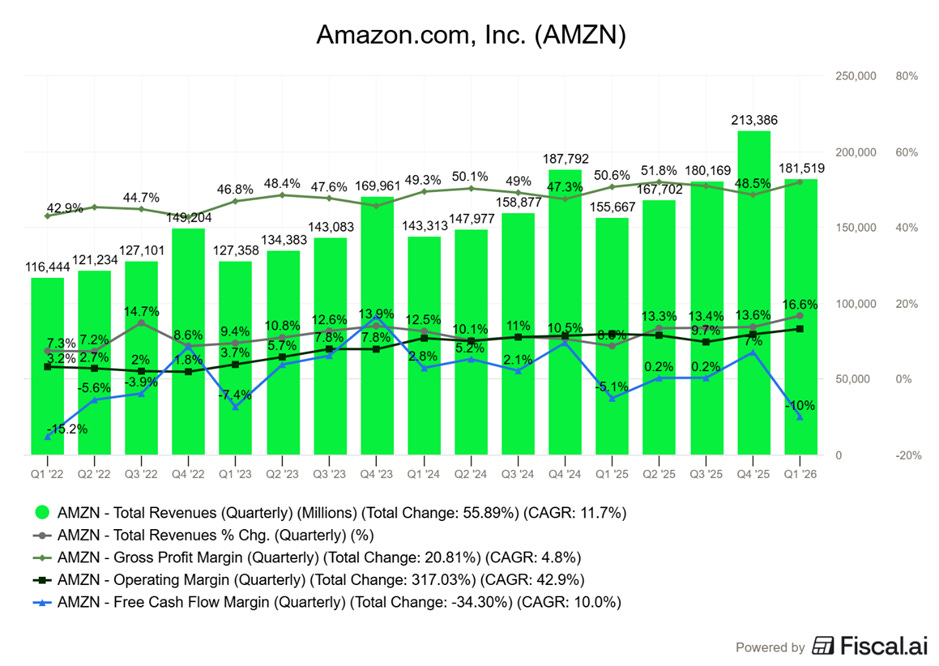
Revenues grew 17% year-over-year (15% excluding foreign exchange) to $182 billion in Q1 FY26. This performance was driven by a resurgence in unit growth in the Stores business and accelerating cloud demand. This performance allowed the company to beat the higher end of its management guidance and consensus estimate by a narrow 1.7% ($179 billion) and 0.9% ($177 billion), respectively.
Q1’26 operating income stood at $24 billion, surpassing the high end of guidance ($22 billion) and consensus estimate ($21 billion). Margin increased to a record 13.1% (+ 130 basis-point year over year) compared to 11.8% in Q1 FY25. Efficiency gains in the fulfilment network and high-margin AWS growth contributed to this improvement.
Amazon reported EPS of $2.78, a jump of 75% from $1.59 in Q1’25. The reported EPS exceeded the consensus estimate of $1.64 billion. It is important to note that net income included pre-tax gains of $16.8 billion from non-operating income related to Amazon’s investments in Anthropic.
Despite Operating Cash flow increasing 30% year-over-year to $149 billion (TTM), free cash flow (TTM) plummeted 95% to $1.2 billion in Q1 FY26. This decline was driven by the massive surge in capital expenditures, with TTM purchases of property and equipment reaching $147 billion (net CAPEX in Q1 stood at $43.2b an increase of 78%). Management remains confident in these investments, noting that AWS must lay out cash for data centers and chips 6 to 24 months before monetization. Growth acceleration does support their confidence in investing for the future so we are fine with that.
Source: Fiscal.ai (affiliate link with a 15% discount for StockOpine readers)
b. Segmental analysis
North America
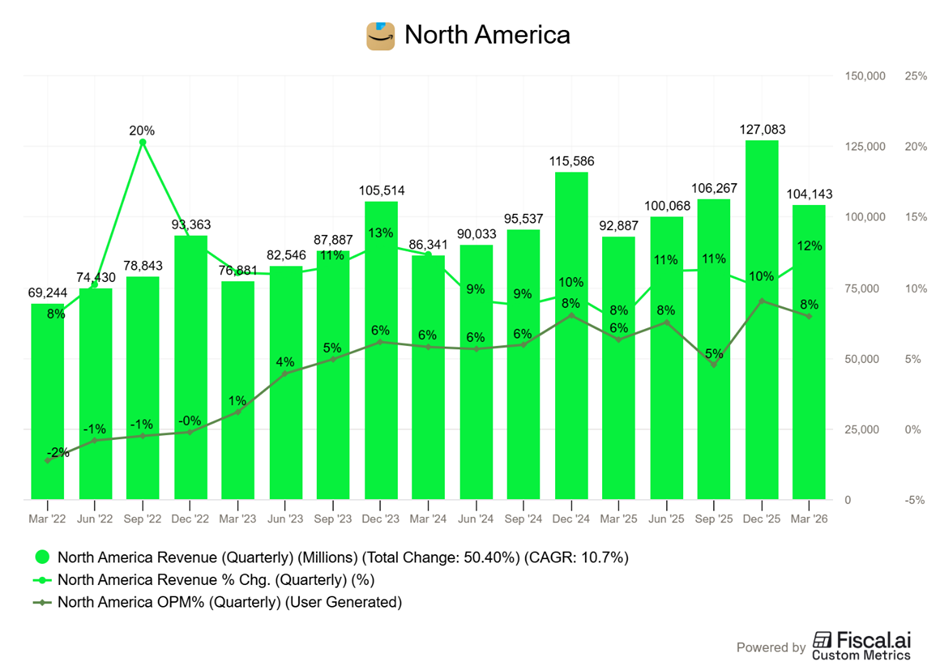
The North America segment reported sales of $104 billion, a 12% year-over-year increase in Q1 FY26. Operating income surged 43% YoY to $8.3 billion, resulting in an 8% margin (an expansion of 173 bps).
Source: Fiscal.ai (affiliate link with a 15% discount for StockOpine readers)
This momentum was driven by a 15% year-over-year surge in unit growth, the highest since the pandemic era. The addition of over 600 new brands such as Ted Baker, PAPATUI by Dwayne Johnson, ONDO, and rapidly scaling grocery business now places Amazon as the second largest grocer in the US. With over $150 billion in 2025 gross sales, the company has seen perishable sales skyrocket over 40x year-over-year, with fresh items now accounting for nine of the top 10 products ordered for same-day delivery. The shift into perishables has significantly improved consumer engagement, as same-day grocery shoppers build baskets nearly three times larger and spend over 80% more than non-grocery customers.
Whole Foods Market is maintaining its upward trajectory, operating over 550 locations today with a pipeline of 100 additional stores set to open over the next few years. By becoming a primary destination for perishables, Amazon has successfully moved from being a discretionary store to a daily utility.
CEO Andy Jassy highlighted that this growth is underpinned by aggressive delivery speeds, including new one and three hour options on 90,000 items on Prime. The company has delivered over 1 billion items same day overnight so far in 2026. To improve the efficiency of their fulfillment team, new, advanced robotics and automation systems are currently being installed in their large U.S. shipping centers opening in 2026.
Furthermore, the average prices of products on the website decreased compared to previous year as a pricing strategy. Its ability to decrease average prices while expanding margins suggests superior supply chain efficiency and strong bargaining power with vendors.
In Q1 2026, third-party seller services generated $41.6 billion in revenue, representing a 14% year-over-year increase (12% excluding foreign exchange). These sellers remain a cornerstone of Amazon’s marketplace, accounting for 60% of total paid units sold during the quarter. Amazon views third-party sellers as essential contributors to its broad selection and competitive pricing. In Q1 2026, seller performance was particularly strong in the U.S., as well as in Europe and Brazil, where Amazon recently lowered seller fees to incentivize growth.
“We’re seeing our investments in the seller experience resonate and, in turn, grow our business. Prime continues to fuel our growth and reflects the value members receive from the program. Prime Video is a key pillar of the Prime value proposition, an important driver of new member acquisition”- Brian Olsavsky, CFO
International
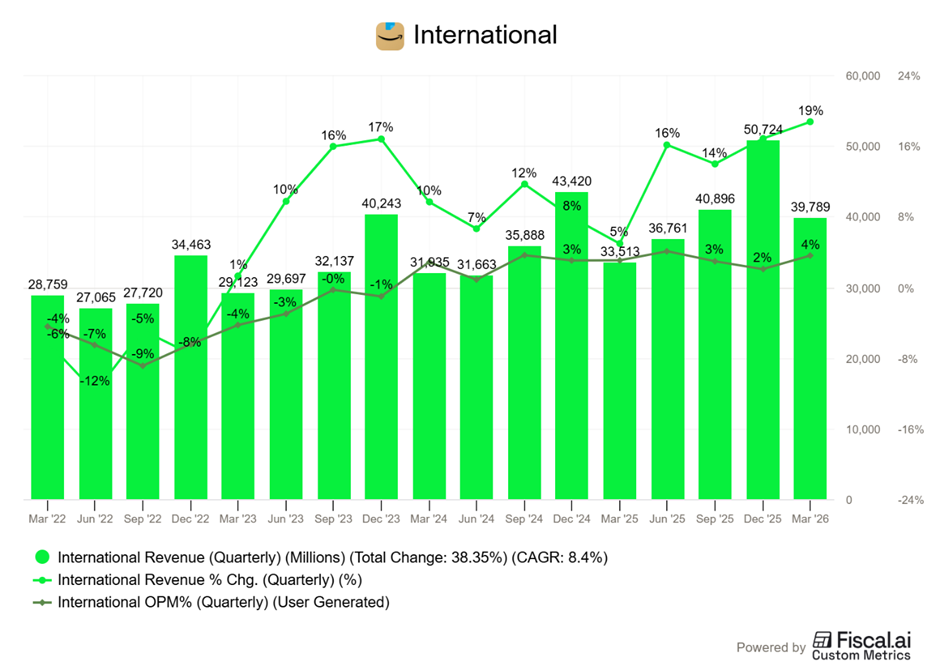
Net Sales grew 19% year-over-year to $39.8 billion in Q1 FY26. The segment reported an operating income of $1.4 billion (+40% YoY), with a margin of 3.5% (+41.6 bps YoY).
The growth was led by their super-fast delivery service, Amazon Now, which brings thousands of items to your door in 30 minutes or less.
“We continue to expand our ultra-fast delivery service, Amazon Now, which offers delivery in 30 minutes or less on thousands of items. It started last year in India, where orders are increasing 25% month-over-month, with Prime members tripling their shopping frequency once they start using it.” Andy Jazzy, CEO
The service is already available to tens of millions of people in nine different countries. They have recently expanded the service to parts of Tokyo and eight major cities in Brazil, with plans to bring it to even more locations soon.
Source: Fiscal.ai (affiliate link with a 15% discount for StockOpine readers)
Advertising
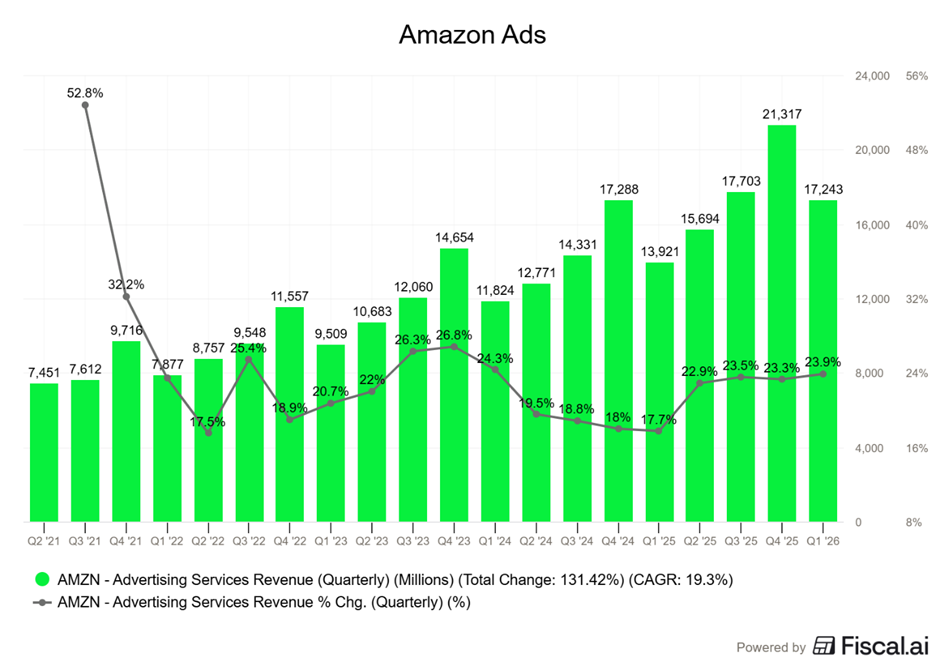
The advertising segment generated $17.2 billion (up 24% or 22% YoY in constant currency) in Q1 FY26. On a TTM basis this is $72m and to put this in perspective it is 1.7x TTM YouTube Ads revenue.
Amazon Ads is aggressively expanding its footprint through high-impact CTV partnerships. The deepening of its Netflix partnership via Amazon Audiences now allows advertisers to layer Amazon’s vast first-party shopping data directly onto Netflix’s premium content for highly precise targeting. Furthermore, a new deal with Comcast Advertising unlocks Prime Video’s massive viewership to local and small-to-medium businesses. Finally, a new integration with Samsung TV Plus introduces Interactive Video Ads, allowing viewers to seamlessly add products to their Amazon carts directly from their television screens using their remotes.
The advertising segment continues to benefit from a two-pronged AI approach. On the one hand, tools like Creative Agent are automating ad campaign generation for brands across seven major international markets, including Canada, France, and the U.K.. On the consumer-facing front, Amazon is successfully monetizing its AI shopping assistant, Rufus. Rufus has evolved into a highly capable agentic tool, able to research products, track prices, and even auto-buy items in the store when they reach a set price. Adoption is surging, with Rufus monthly active users growing by 115% and engagement up nearly 400% year-over-year. This massive engagement is translating to advertising success: nearly 20% of shoppers who interact with sponsored brand prompts inside the Rufus interface continue their conversation to learn more about the brand.
Source: Fiscal.ai (affiliate link with a 15% discount for StockOpine readers)
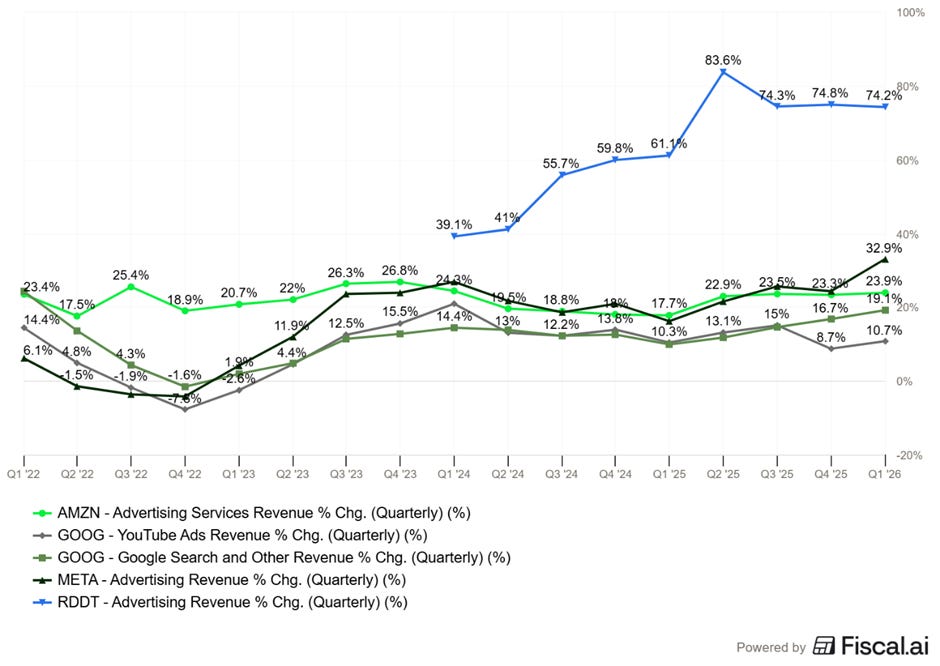
Source: Fiscal.ai (affiliate link with a 15% discount for StockOpine readers) / Note: We share this chart for completeness in comparing Amazon to peers.
AWS
AWS net sales surged 28% year-over-year to $37.6 billion in Q1 FY26, reaching an annualized revenue run rate of $150 billion. Operating income jumped 23% to $14.2 billion, maintaining an operating margin of 37.7%.
Key highlights for AWS include: