

Booking reported its Q2 2026 financial results few days ago, delivering another beat. Despite ongoing geopolitical headwinds due to the conflict in the Middle East which affects long-haul international travel and flight ticket growth, the business demonstrated strong domestic travel resilience and disciplined cost execution.
Before we dive into the results, a word from our sponsor.
Track your Stocks, Dividends, ETFs & more all in one place with Sharesight Investment Tracker
Still tracking your investments in a spreadsheet? There’s a better way. Sharesight tracks your stocks, trades, dividends, ETFs, stock splits & more all in one place. Benchmark your portfolio against any investment, view your portfolio’s diversity, see upcoming dividends & more - try Sharesight for free.

1. Financial Results
Booking Holdings continued to expand its operating margins while utilizing its strong cash generation to fund record shareholder buybacks.
Revenue
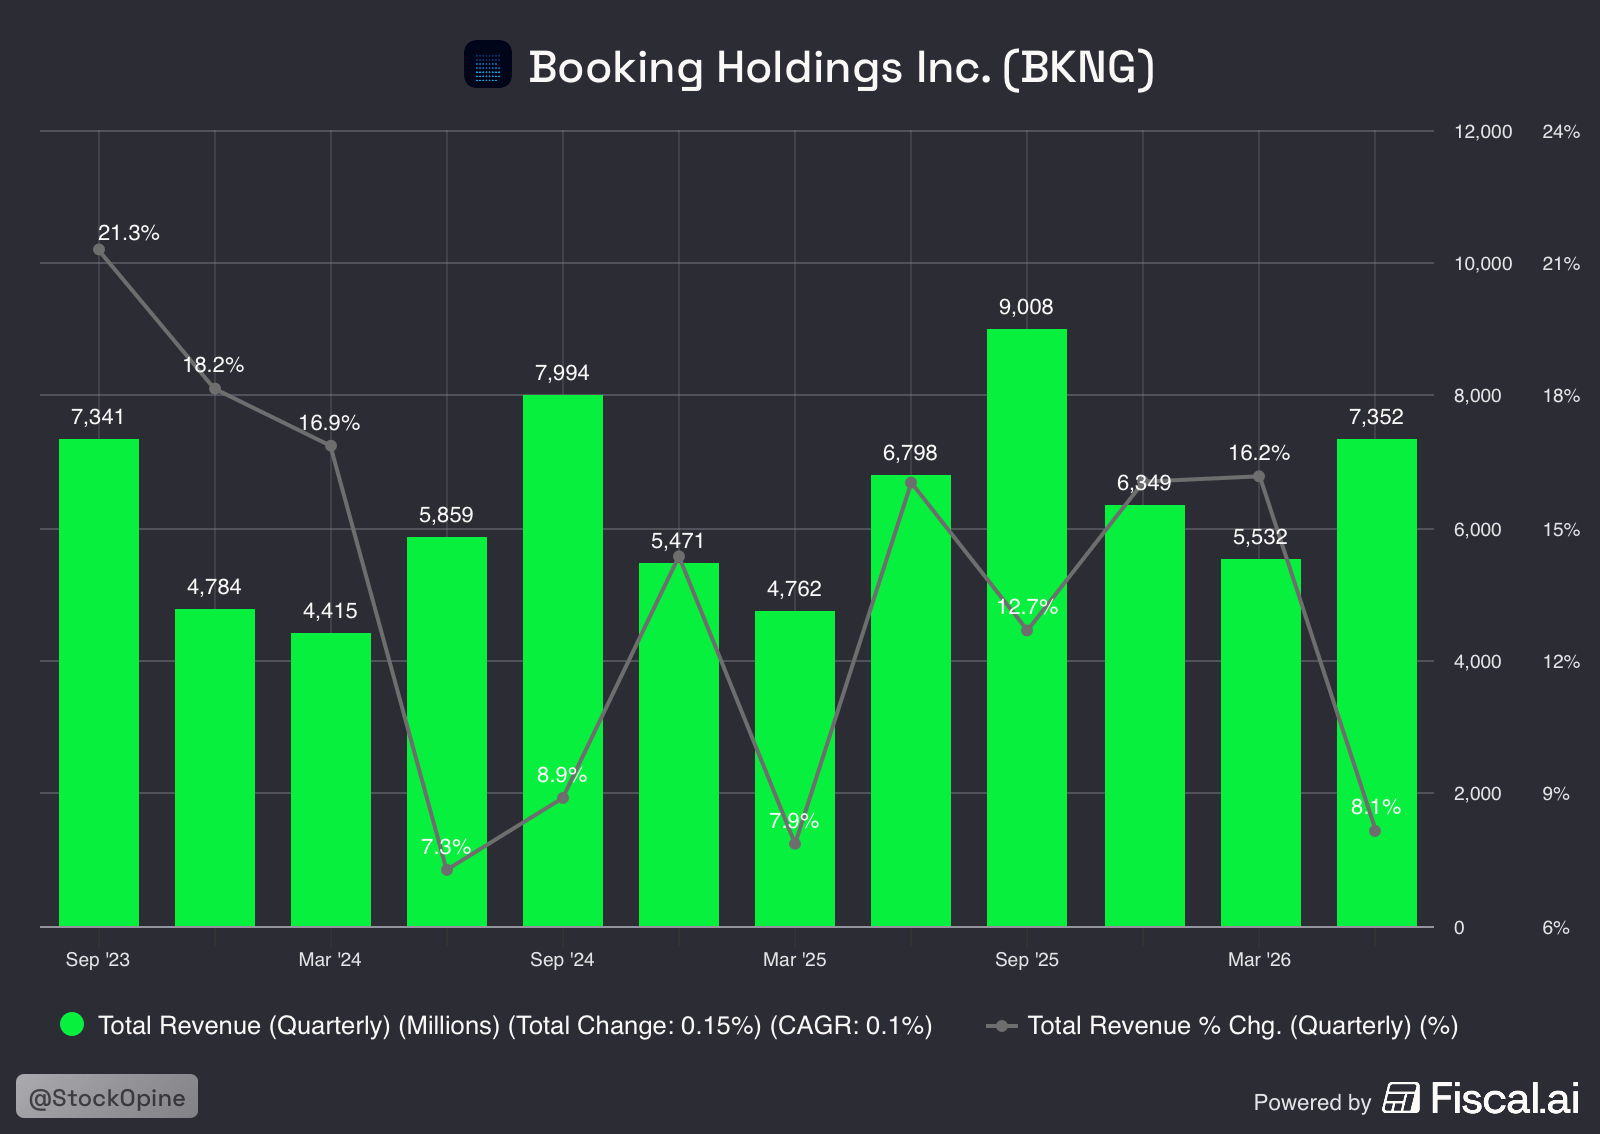
Revenue reached $7.35 billion, representing an 8% YoY growth on a reported basis (7% YoY on a constant currency basis). Revenue growth lagged gross bookings growth primarily due to the flow-through of increased cancellations experienced in late March following the Middle East conflict. This was partially offset by a positive contribution from higher payment facilitation revenues.
Source: Fiscal.ai (affiliate link with a 15% discount for StockOpine readers)
Adjusted EBITDA & Operating Leverage
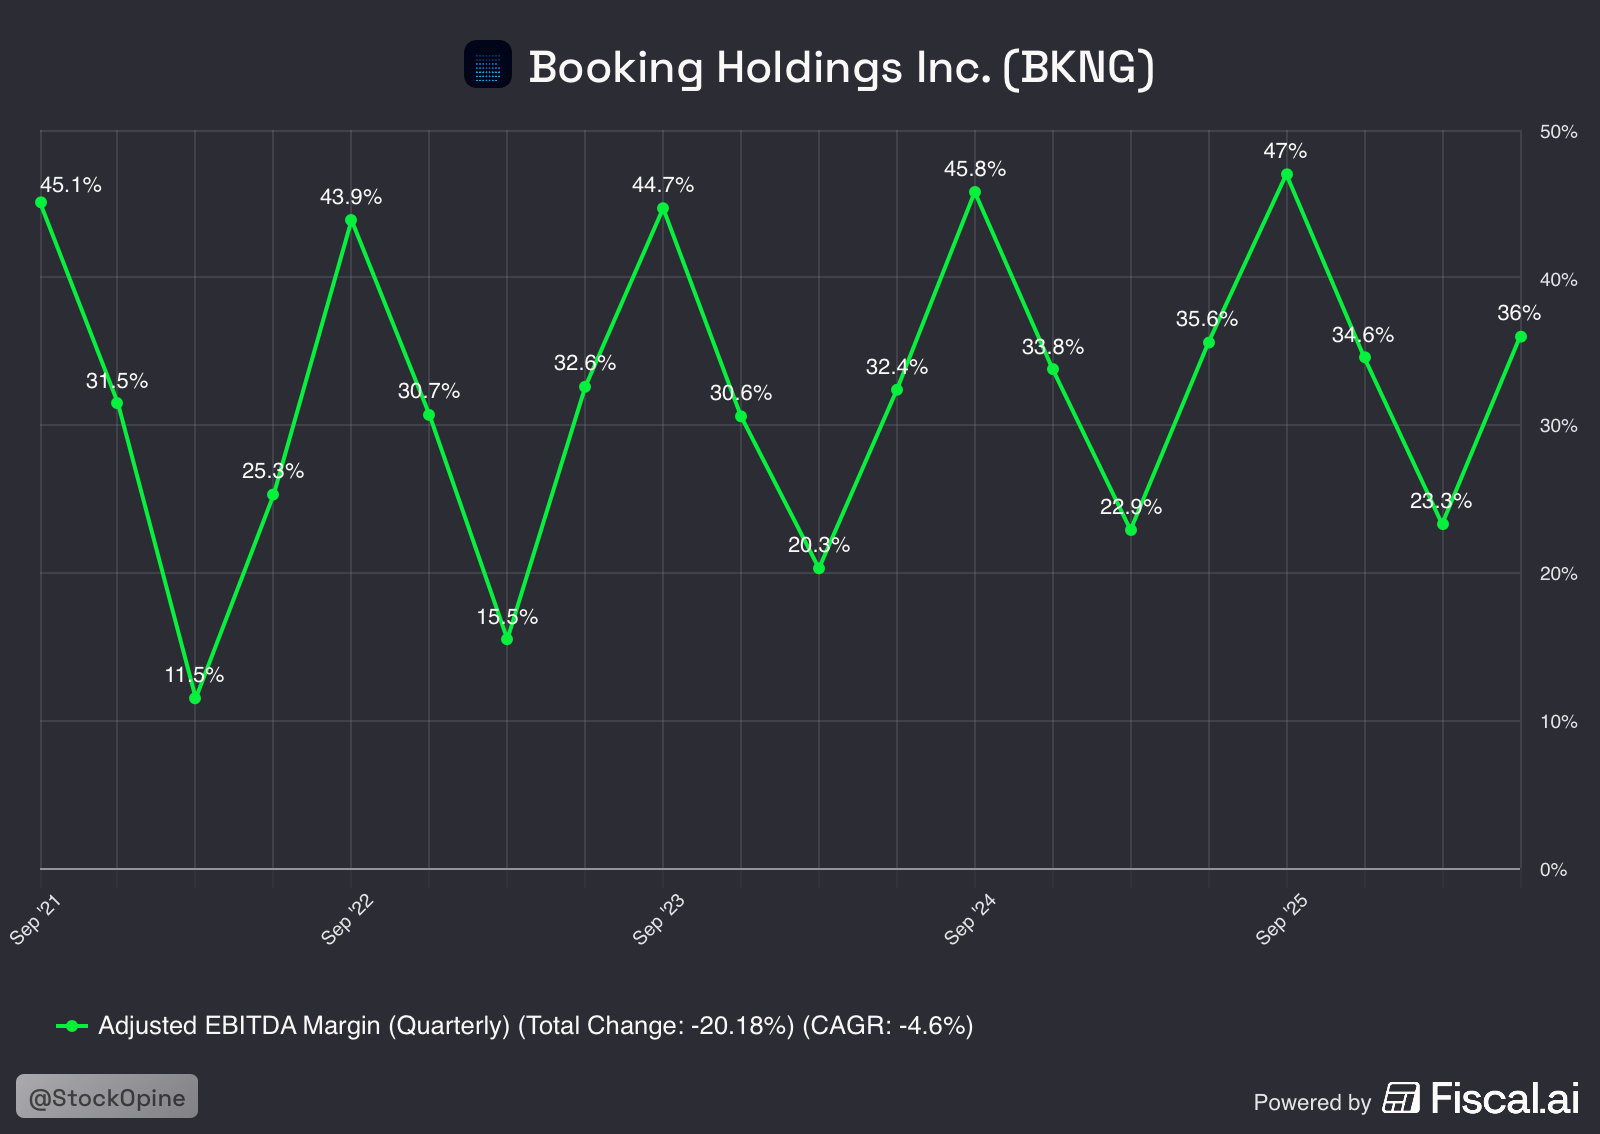
Adjusted EBITDA for Q2 2026 came in at $2.65 billion, up 9% YoY. The Adjusted EBITDA margin expanded by nearly 40 basis points YoY to 36.0% (up from 35.6% in Q2 2025). Margin expansion was achieved through operating leverage offsetting slightly elevated performance marketing investments.
Source: Fiscal.ai (affiliate link with a 15% discount for StockOpine readers)
Adjusted EPS
Adjusted EPS reached $2.54, representing a 15% YoY increase. EPS growth outpaced EBITDA growth due to a 6% YoY reduction in weighted-average diluted share count driven by aggressive share repurchases.
Capital Returns & Free Cash Flow
Free Cash Flow (FCF) reached $3.64 billion for the quarter, up 16% YoY. Capital returns reached a record $4.1 billion in Q2, consisting of $3.7 billion in share buybacks and $324 million in cash dividends ($0.42 per share). Year-to-date, the company has deployed $7.45 billion in common stock repurchases.
2. Key Performance Indicators
a. Nights Booked & Regional Performance
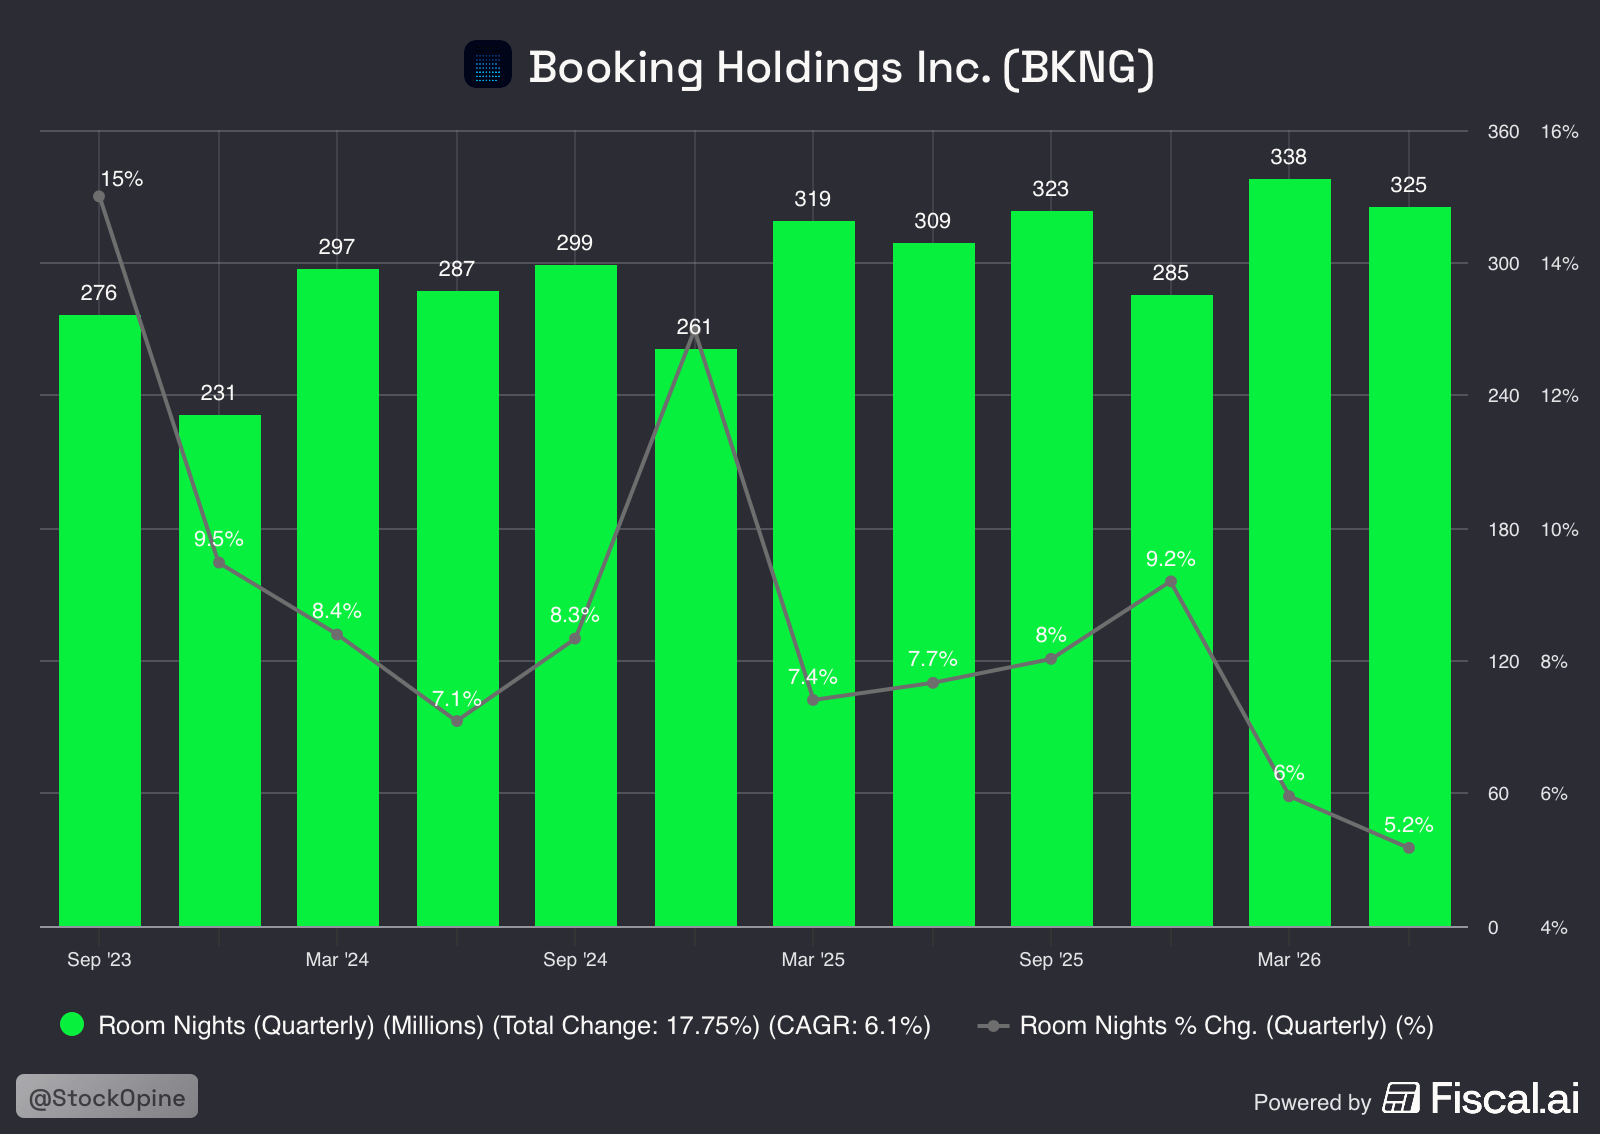
Room nights booked in Q2 reached 325 million, up 5% YoY. Management noted that indirect impacts from the Middle East conflict (softer long-haul travel, elevated flight prices and route capacity shifts) continued to pressure international room night growth. However, domestic travel (travel within a traveler’s own country) remained healthy across major regions.
Europe: Up mid-single digits YoY (domestic room nights up high-single digits).
Asia: Up mid-single digits YoY (domestic room nights up low-double digits).
United States: Up high-single digits YoY, driven by domestic demand and continued expansion in direct channel bookings.
Rest of World: Up mid-single digits YoY, recovering from a low-single-digit decline in Q1 2026 as bookings from Middle East bookers normalized.
Source: Fiscal.ai (affiliate link with a 15% discount for StockOpine readers)
b. Gross Bookings & Travel Verticals
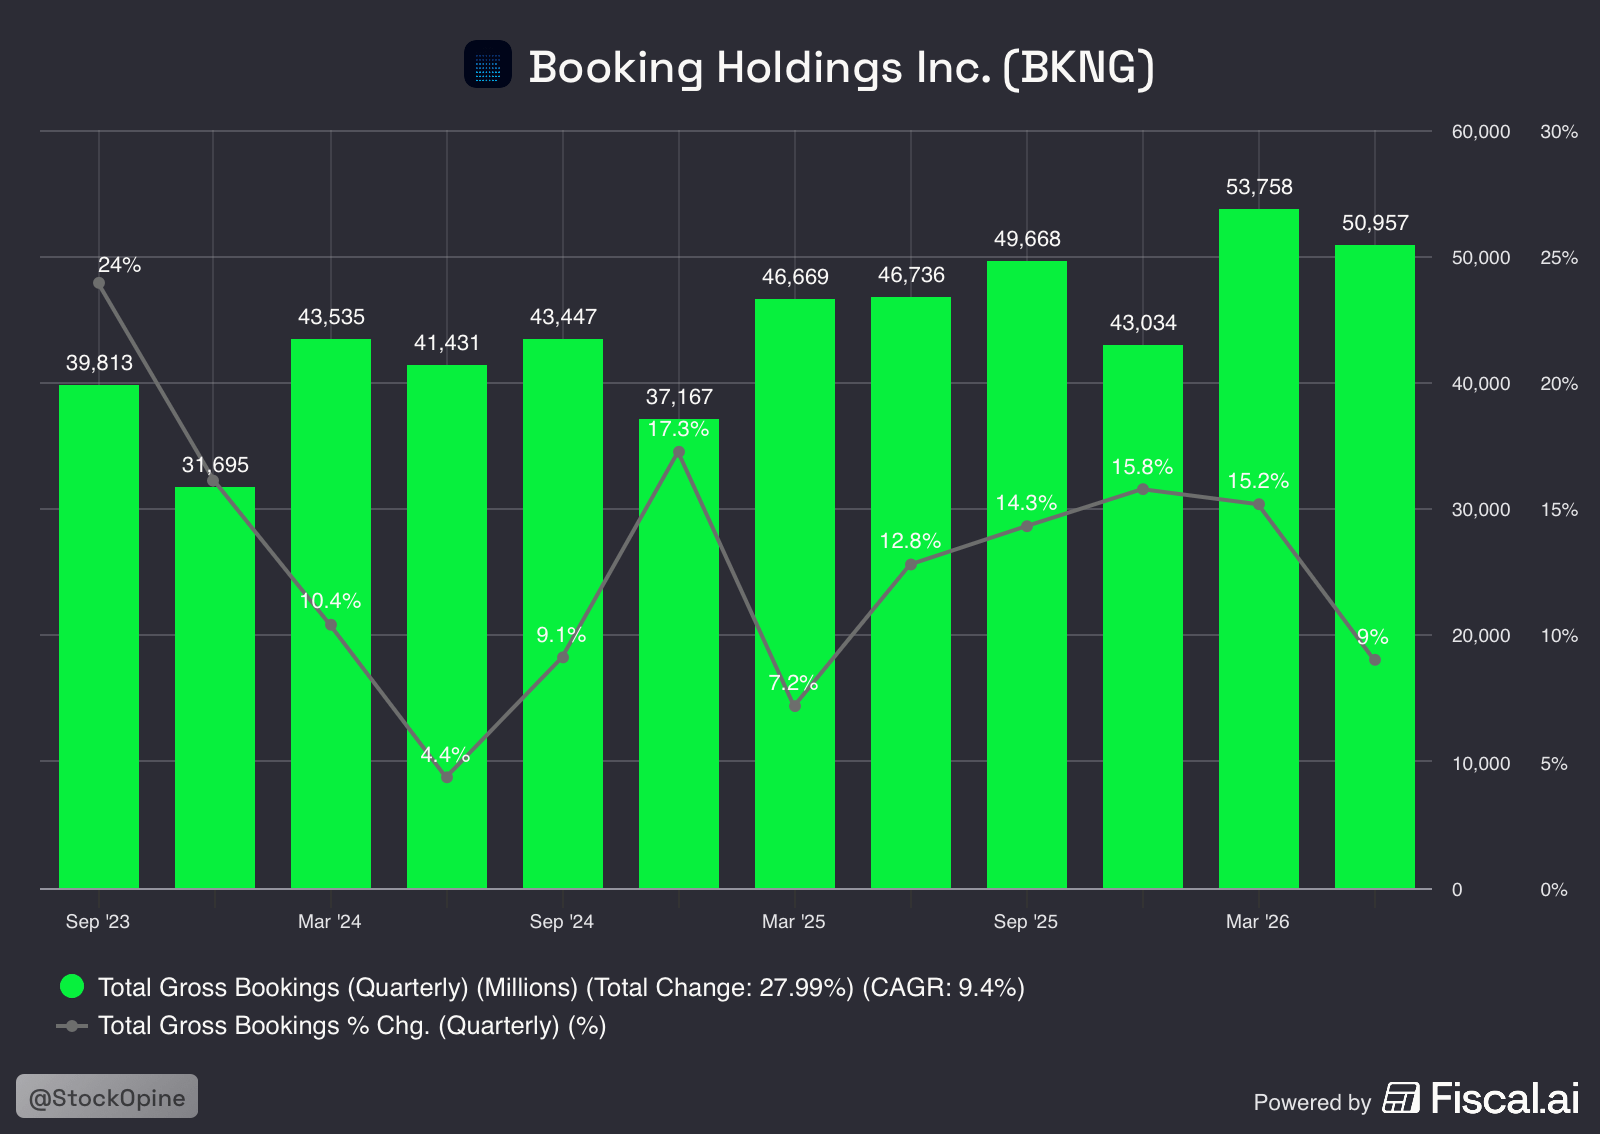
Gross Bookings reached $51.0 billion, an increase of 9% YoY (8% on a constant currency basis). The expansion was supported by a ~2% YoY increase in constant currency Accommodation Average Daily Rates (ADRs).
Source: Fiscal.ai (affiliate link with a 15% discount for StockOpine readers)
Other Verticals:
Flight Tickets: Rose 3.7% YoY to 17 million tickets. Gross flight bookings grew 12% YoY, due to higher average ticket prices and fuel costs (price growth of 8%). The deceleration in ticket volume growth was primarily caused by constrained global airline capacity and a subsequent spike in flight ticket prices, rather than a lack of traveler interest. Management noted that Asian travel was hit due to the ongoing impacts of the war, pressuring long-haul international flight volumes.
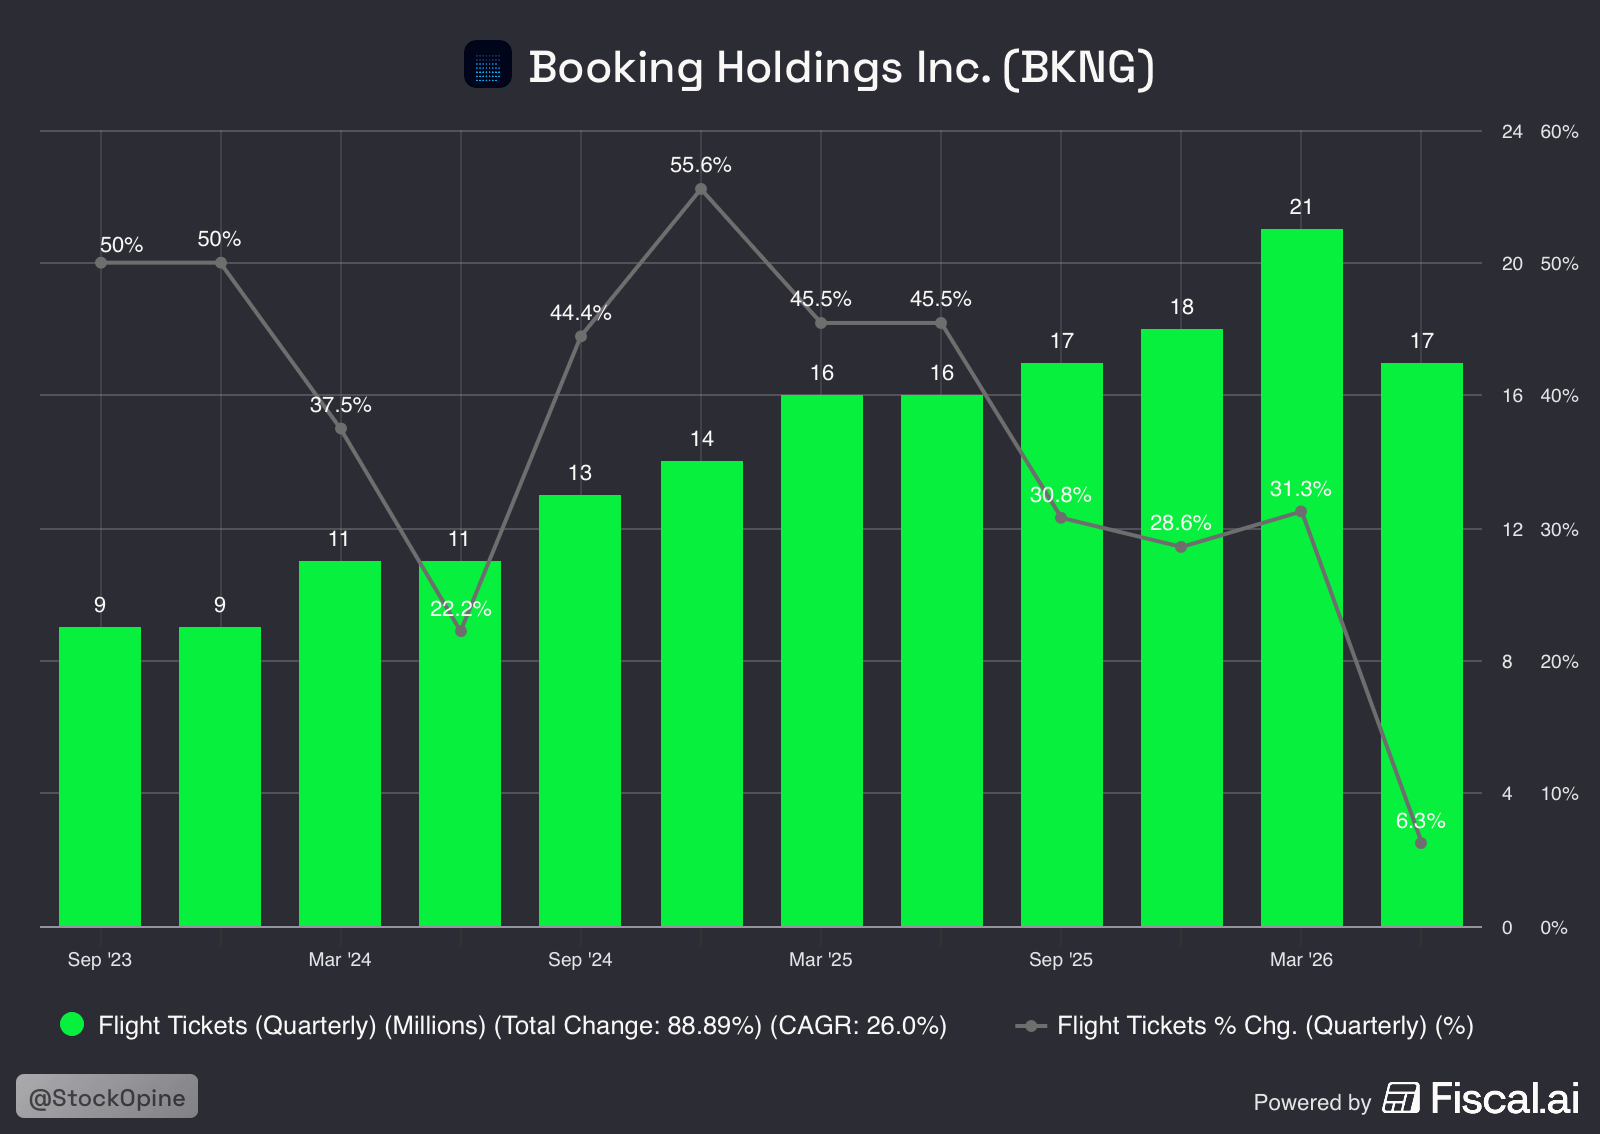
Source: Fiscal.ai (affiliate link with a 15% discount for StockOpine readers) - something’s wrong on the growth rate shown on the fiscal ai chart
Rental Car Days: Totaled 23 million days, down 6.5% YoY due to lower partner volume and elevated rental daily rates.
Attraction Tickets: Grew double digits YoY.
3. Alternative Accommodation
Booking’s alternative accommodation segment continued to expand its global inventory supply:
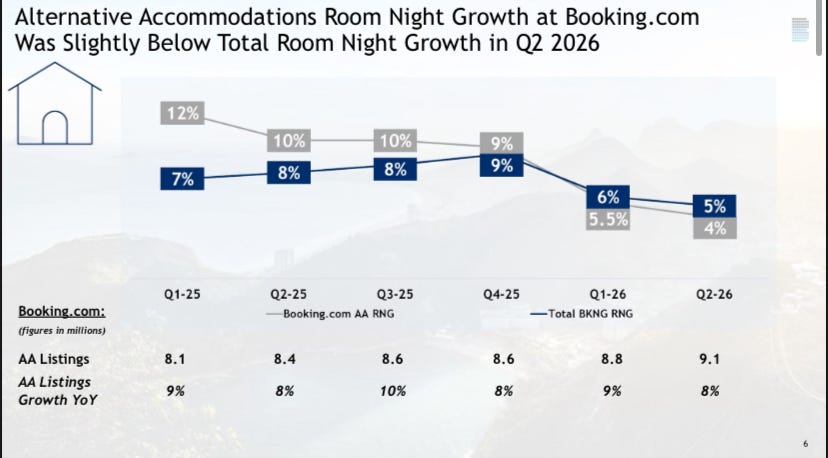
AA Room Nights: Increased 4% YoY in Q2. Growth was slightly lower than overall room night growth due to brand mix (faster growth at Agoda/Priceline) and regional mix in the US, where the alternative accommodation footprint remains smaller.
Mix Share: Alternative accommodations represented ~37% of Booking.com total room nights, steady with Q2 2025 levels.
Active Supply: Active AA listings on Booking.com reached 9.1 million, an 8% YoY increase.
The setup here is clear: the supply is growing (up 8%), but the demand (up 4%) took a temporary hit due to geopolitical pressure and regional brand strength with Glenn Fogel once again noting that they must do more to raise brand awareness in the US as he wants that growth rate to be higher. For example, Airbnb achieved a high single digit growth in North America which was their highest growth in the last 3 years, justifying why Booking has to do more!
Source: Booking’s Q2 2026 Earnings Report
4. Direct, App and Loyalty Mix
Booking Holdings continues to deepen its direct relationship with travelers:
Mobile App Mix: On a Trailing Twelve Month (TTM) basis, mobile app bookings reached the high-50% range of total room nights (up from the mid-50% range in Q2 2025).
Direct Channel Mix: The TTM B2C direct booking mix held stable in the mid-60% range. Direct channel engagement expanded despite broader search engine optimization (SEO) visibility headwinds across consumer internet channels.
Genius Loyalty Mix: Higher-tier Genius members (Level 2 and Level 3) accounted for a high-50% share of Booking.com’s TTM room nights (up from the mid-50% range in Q2 2025). Level 2 and Level 3 members represent over 30% of active customers and exhibit higher repeat rates and direct booking tendencies.
5. Merchant Expansion & Cash Generation
The ongoing transition from an agency model to a merchant model at Booking.com remains a key structural growth engine:
Merchant Mix: Merchant Gross Bookings represented 73% of total gross bookings in Q2 2026, up 4 percentage points from 69% in Q2 2025.
In addition to enabling integrated payment options, the merchant platform generates significant cash float via deferred merchant bookings ($10.1 billion balance at quarter-end). Interest and dividend income generated $201 million in Q2 2026.
This multi-year structural transition remains a major operational win for Booking Holdings as it serves as the foundational bedrock for the Connected Trip strategy.
6. Other highlights
Connected Trip Growth: Connected Transactions (bookings across more than one travel vertical for the same trip) grew in the low double-digit range YoY, outpacing total transaction growth and accounting for a low double-digit percentage of Booking.com’s total transactions.
Transformation Savings: Management raised its expected annual run-rate cost savings from the Transformation Program from ~$550 million to ~$650 million, with the additional ~$100 million expected to be realized primarily in 2027.
AI Capabilities: The group scaled voice AI in customer service (driving double-digit reductions in customer service cost per booking) and continued testing agentic AI discovery tools, including Priceline’s Penny assistant, Booking.com’s AI trip planning experience, and Agoda’s visual AI gallery view.
7. Outlook & Guidance
Management provided the following forward guidance for Q3 2026 and FY 2026, assuming the continuation of indirect Middle East conflict impacts through Q3:
Q3 2026 Guidance
Room Nights Growth: +3% to +5% YoY
Gross Bookings Growth: +4% to +6% YoY (+5% to +7% CC)
Revenue Growth: +4% to +6% YoY (+5% to +7% CC)
Adjusted EBITDA Growth: +4% to +6% YoY
Full-Year 2026 Guidance
Gross Bookings Growth: High single digits YoY
Revenue Growth: High single digits YoY
Adjusted EBITDA Growth: High single digits YoY
Adjusted EPS Growth: Low to mid-teens YoY
8. Concluding Remarks
Booking Holdings’ Q2 2026 earnings report once again proved the company’s ability to compound earnings and free cash flow even amidst regional geopolitical issues. The moat around direct traffic (mid-60s% mix), mobile app dominance (high-50s% mix), and expanding Genius member engagement continues to strengthen.
Furthermore, the expansion of the Transformation Program run-rate savings target to ~$650 million showcases management’s commitment to efficiency and cost discipline. This is an exceptional compounder and with a P/E below 25x, we are confident to hold it in our portfolio for the long run.