While on the hunt for new stock ideas, we applied different screening metrics from the usual ones and must admit that the results were rather impressive. This led us to choose the next company that we will cover in more detail in July 2024.
The metrics included, among others, a deviation from the 52-week high—a rather contrarian approach—but also accounted for important parameters such as returns on capital and estimated revenue and profitability growth.
Screening outcome
Source: Koyfin (get 20% off if you use our link) | Note: The screening criteria are visible in the image above (click to enlarge).
Do the largest three names sound familiar? Let's take a glimpse at them.
1. Monster Beverage Corporation (MNST)
a. Company Overview
Monster Beverage Corporation, founded in 1985 and headquartered in Corona, California, is a leading developer, marketer, and distributor of energy drink beverages and concentrates. The company operates through three main segments: Monster Energy Drinks, Strategic Brands, and Other. It offers a wide range of products including carbonated energy drinks, non-carbonated beverages, ready-to-drink iced teas, lemonades, juice cocktails, dairy and coffee drinks, sports drinks, and flavored sparkling beverages.
b. Revenue Segmentation
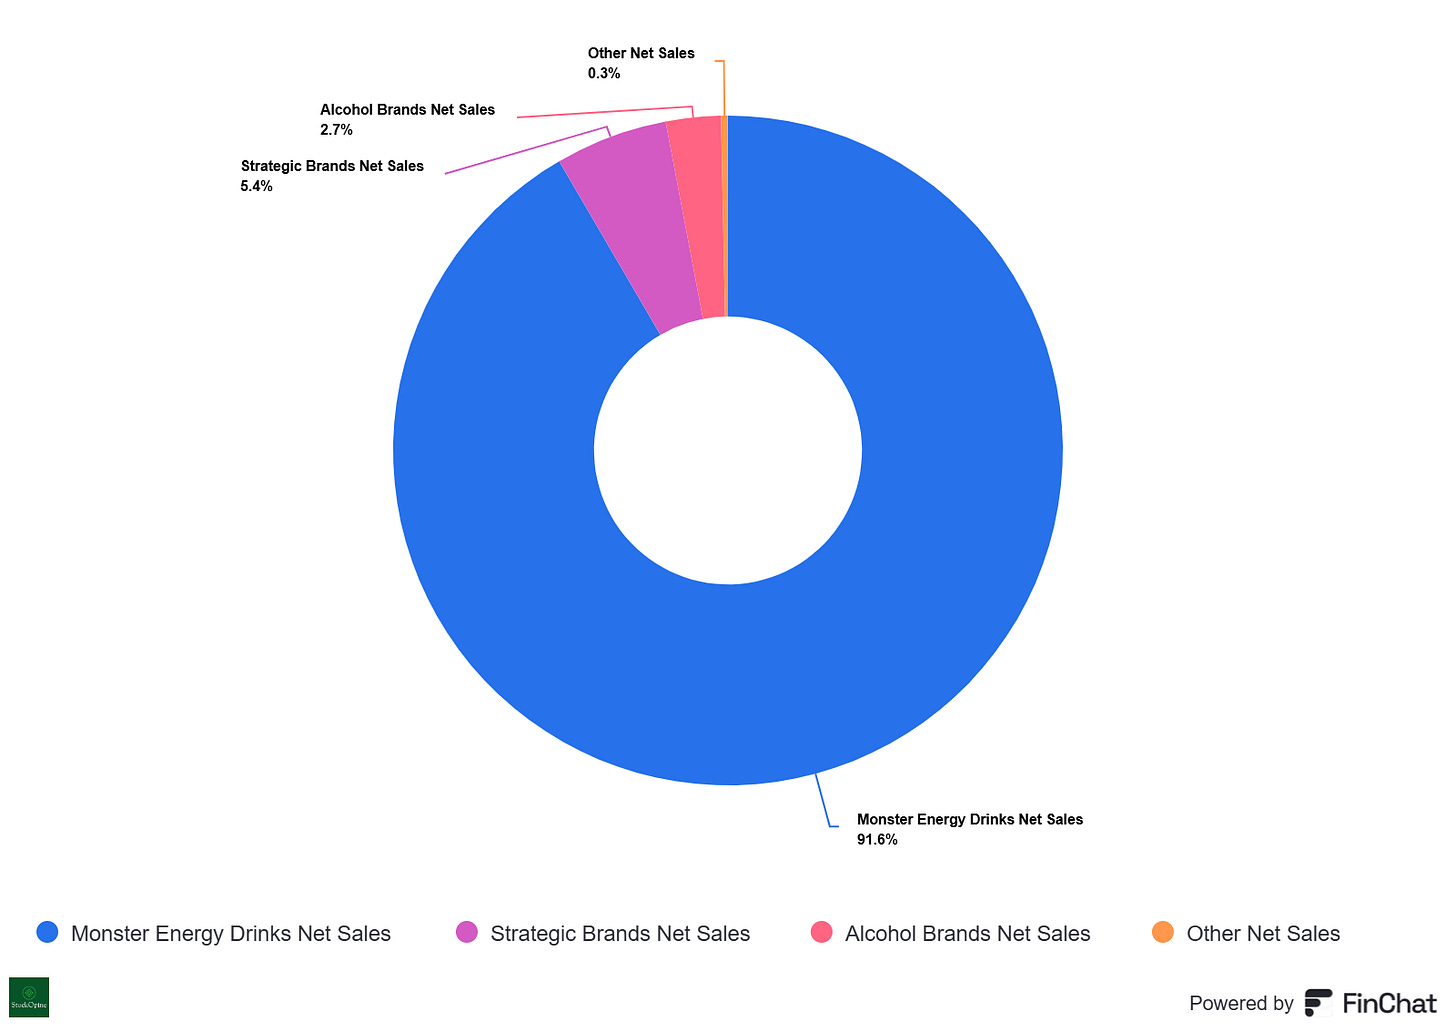
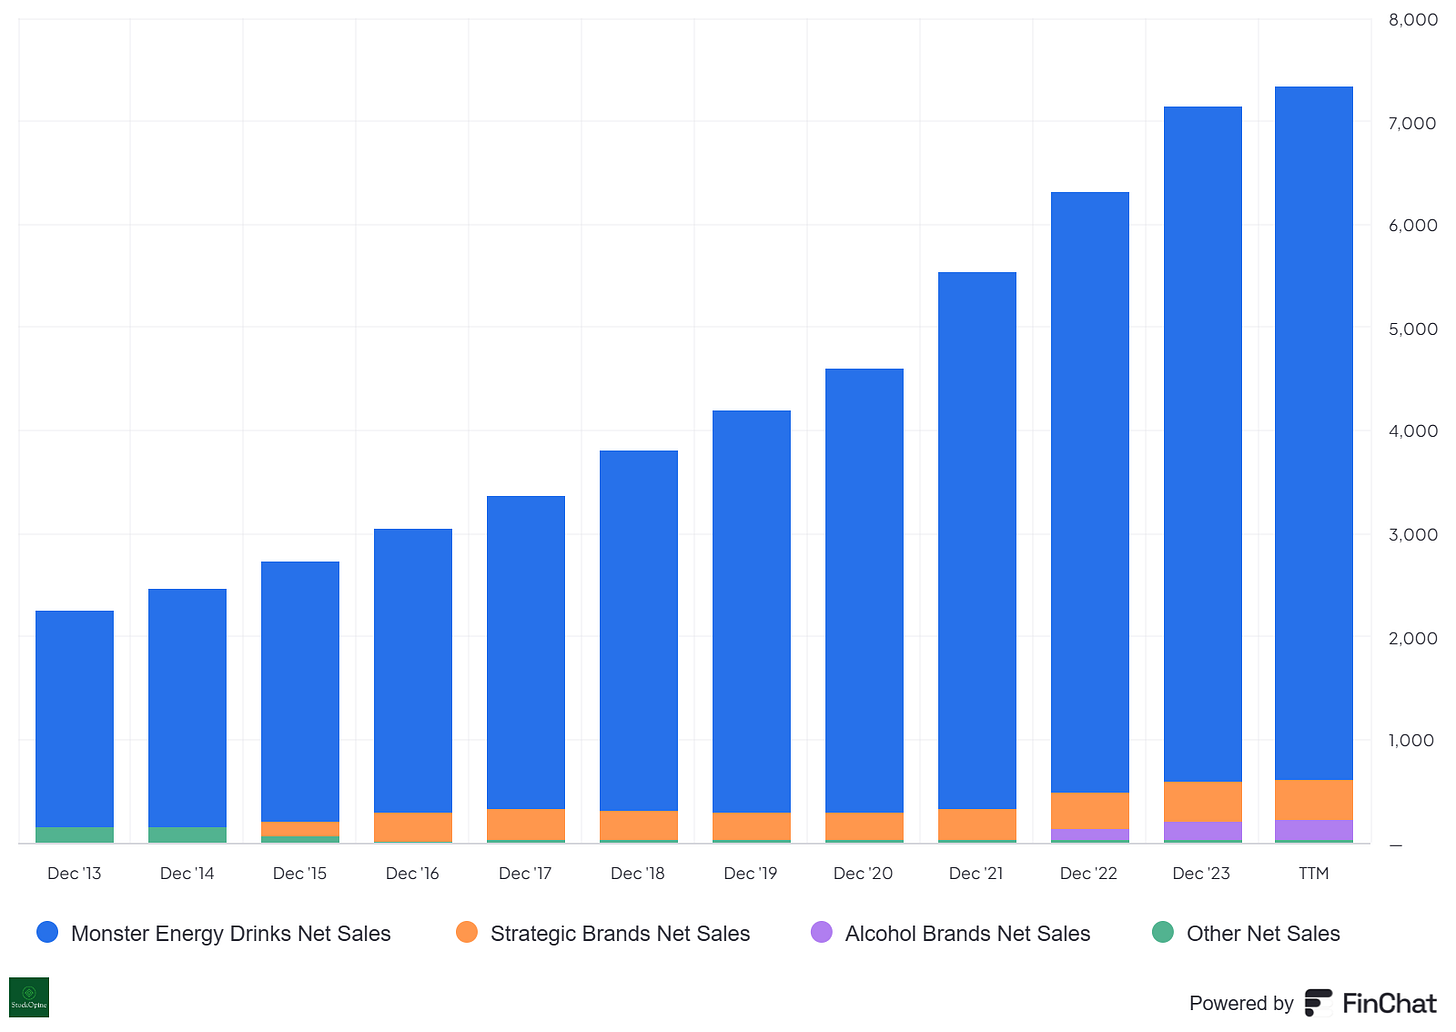
Monster Energy Drinks: This segment is the largest, contributing approximately 91.81% of the total revenue with net sales of $6,555.09 million for the fiscal year ending December 31, 2023.
Strategic Brands: This segment accounts for 5.27% of the total revenue with net sales of $376.59 million.
Alcohol Brands: This segment contributes 2.59% of the total revenue with net sales of $184.86 million.
Other: This segment accounts for 0.33% of the total revenue with net sales of $23.49 million.
Source: Finchat.io → 15% discount for StockOpine readers
c. Growth Rates
Revenue Growth:
3-Year CAGR: 15.37%
5-Year CAGR: 13.47%
10-Year CAGR: 12.31%
Source: Finchat.io → 15% discount for StockOpine readers
EPS Growth:
3-Year CAGR: 5.23%
5-Year CAGR: 11.17%
10-Year CAGR: 16.11%
Source: Finchat.io → 15% discount for StockOpine readers
d. Profitability Metrics
Gross Profit Margin: 53.45%
EBITDA Margin: 29.18%
Operating Margin: 28.19%
Net Profit Margin: 22.83%
5 Year Returns on Equity: 24.51%
e. Valuation Metrics (TTM)
P/E Ratio: 30.81 (3Y average 40.2)
P/B Ratio: 5.91
EV/Sales: 6.4
EV/EBITDA: 22.05 (3Y average 28.1)
Enjoy our work? Take a moment to answer this survey. Your feedback will help us improve our offering!


