

The deep dive report of KLA Corporation (“KLA”, “KLAC” and “Company”) will be released in two parts where the first part analyses its Operations, Industry, Leadership & Culture and Financials (sections 1-4) and the second part describes KLA’s Risks, Competitive positioning, and Opportunities and concludes with a high level DCF calculation and our remarks (sections 5-9).
The structure of the report will be as follows:
The Company
Industry
Leadership and Culture
Financial Analysis
Risks
Moat / Competitive Positioning
Opportunities
Valuation
Concluding Remarks
1. The Company
Description
KLA was formed in 1997 through the merger of KLA Instruments Corporation and Tencor Instruments and is a leading supplier of process control and yield management solutions and services for the semiconductor and related electronics industries. KLA has a broad portfolio of inspection and metrology products, and related service, software and other offerings, which support R&D and manufacturing of integrated circuits (“IC”), wafers and reticles.
The systems of the Company are used to detect, analyse and resolve critical and nanometric level product defects helping its customers to manage challenges during the manufacturing process at various steps in a semiconductor's development and to obtain higher finish yields at a lower cost. It also offers advanced technology solutions to address various manufacturing needs of Printed Circuit Boards (“PCB”), Flat Panel Displays (“FPD”), Specialty Semiconductor Devices and other electronic components, including advanced packaging etc.
Operations and Segments
The operations of KLAC are governed by the so called KLA Operating Model which KLA’s management (“Management”) considers as the reason of its success and the guide for its future. This model has 3 pillars, namely, Collaboration, Innovation and Execution.
Collaboration is working closely with clients and suppliers, Innovation is investing heavily in R&D (accounts for over 55% of operating expenses) and talent and Execution is delivering results. Throughout its history, KLA consistently delivered results by growing its net income for the last 10 years by a compound annual growth rate (“CAGR”) of 16.0%.
The key driver of KLAC’s business is the capital expenditures (“CAPEX”) of semiconductor, semiconductor related and electronic device manufacturers as well as its ability to meet or even exceed customer needs (i.e. customers optimizing the return on their investment). Although its business was historically considered as cyclical, there are secular growth factors for the semiconductor industry such as Artificial Intelligence (“AI”), 5G, Electric Vehicles (“EV”), Big Data, Internet of Things (“IoT”), digitization etc.
The Company has 3 business units (“BU”), namely, Semiconductor Process Control (“Semi PC”), Electronics, Packaging and Components (“EPC”) and Services. Based on the latest available data that it was provided on its Investor Day these segments generated $5.4B, $0.95B and $1.8B of Calendar Year (“CY”) 2021 revenue, respectively. While Semi PC is the backbone of its operations, the EPC BU was effectively formed in 2020 following the acquisition of Orbotech for $3.26B in February 2019 and combined with prior acquisitions of SPTS and ICOS enabled the Company to enhance its offering to its customers (below graph).

Source: KLA Investor Day 16th June 2022 presentation
Reporting wise there are 3 key segments, namely Semiconductor Process Control (“SPC”) which grew by 38% in the Fiscal Year ended on June 2022 (“FY22”) to $7.9B, Specialty Semiconductor Process (“SSP”) that grew by 24% to $457M and PCB, Display and Component Inspection (“PCBDC”), which grew by 2% to $832M. The gross margins of the 3 segments average to mid-60s, mid-50s and mid-40s, respectively.
SPC consists of a portfolio of inspection, metrology and data analytics products as well as related services that assist IC manufacturers to achieve targeted yields throughout the semiconductor fabrication process; SSP consists of advanced vacuum deposition and etching process tools used by specialty semiconductor customers; and PCBDC consists of a range of inspection, testing and measurement and direct imaging for patterning products used by manufacturers of PCBs, FPDs, advanced packaging, microelectromechanical systems and other electronic components.
Our best guess is that SPC excluding services makes the Semi PC BU and SSP with PCBDC excluding services make the EPC BU, as over 98% of the goodwill recognized on Orbotech acquisition (EPC) was allocated to SSP and PCBDC.
It shall be noted that back in FY18, before the acquisition of Orbotech, SSP revenues were $0 and PCBDC were negligible amounting to $93M.

Source: KLA’s 10K filing FY22, StockOpine analysis, Notes: Segment revenues exclude corporate allocations and FX effects
KLA also reports by its major products and as it can be observed from the below table Wafer Inspection and Patterning which are offered in SPC is the chunk of its revenue.
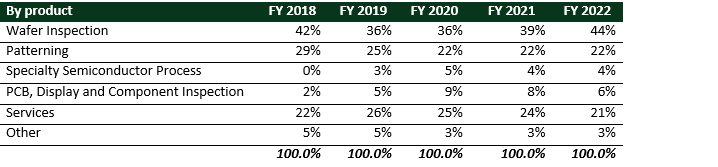
Source: KLA’s 10K filing FY22, StockOpine analysis
Customers and Geographic Exposure
As indicated above, the key driver of revenue growth is the CAPEX of key players and KLA is heavily dependent on two customers, namely Taiwan Semiconductor Manufacturing Company Ltd (“TSM”) and Samsung Electronics Co., Ltd (“SSNLF”, “Samsung”) which account for 32% of its total revenue in FY22 (in line with FY21 and lower than FY20 of 34%).
Geographically, the majority of revenue is generated from Asia (83% in FY22) with China and Taiwan accounting for more than 45% of FY22 revenue.
Source: KLA’s 10K filing FY22, StockOpine analysis
The revenue concentration makes sense given the corporate consolidation in the industry and the fact that the majority of semiconductor manufacturing is outside US (only 12% in US) 2021-SIA-State of the Industry Report, especially in more advance technology for Logic <10nm, where Taiwan is the undisputable leader (>90% in 2019).
KLA on its Investor Day also shared a graph in which it estimated that 80% of Semi production in 2021 was in Asia.
The customer composition has two risks: A) customer concentration may give large customers a bargaining power, however, history has proven that the relationship with its top clients is strong and B) supply and demand challenges due to the ongoing US-China tensions, such as export licensing requirements, CHIPS Act to reignite manufacturing in US and the recent Nancy Pelosi’s visit to Taiwan.
The strength of the relationship that KLA has with its clients can be supported by a) the consistently high gross margins at the low 60% (more details in section 4), b) the decade-long relationships, c) the high and increasing market shares (more details in section 6) and d) the comment made by Ahmad Khan President, Semiconductor Process Control, that the top 5 customers clearly understand that lead times are longer and the need to provide forecasts until 2023, ’24 and sometimes ’25 which further demonstrates the relationship and collaboration with customers.
In regards to US-China tensions our guess would be as good as yours. Despite this, government initiatives across the globe such as CHIPS Act, European Chips Act etc. could normalize the reliance on Asian countries. As Rick Wallace, President and CEO mentioned on the Investor Day, there are about >60 programs across the world that try and replant manufacturing. That makes the normalization a tough journey but will somehow smooth macro cycles.
2. Industry
Industry & Outlook
As it was disclosed in the latest Investor Day, the Semiconductor industry is estimated to exceed $1T by 2030 depicting a CAGR of c.7% with Rick Wallace, CEO noting that
the industry will grow at a higher rate because, as I mentioned earlier, there are so many additional drivers to semiconductors. And those additional drivers, in many ways, make the industry more resilient. [5G being is one of those drivers and] we are relatively early on that.
For the key addressable market i.e. Wafer Fab Equipment (“WFE”) the outlook (per management) as per the Investor Day was estimated to be around $100B in 2022 (compared to $86B in 2021) and to increase to about $125B by 2026 (Bren Higgins, EVP and CFO) representing a CAGR of 7.5% from 2021 to 2026. Due to the persistent supply chain challenges, the Management revised its outlook downwards to $95B over the recent earnings call Q4 FY'22.
The key players of WFE are among others, ASML, Applied Materials, Tokyo Electron, Lam Research, Hitachi High Technologies and KLA. KLA WFE market share is estimated (per Management) at 6.2% in 2021, up from 5.7% in 2018. As it was indicated on the Investor Day, the Company is expected to gradually increase its market share to around 7.25%+ by 2026.
KLA which mainly operates in Process Control, noted on its Q3’22 earnings call, that Process Control was the fastest growing segment of WFE, growing 43% in 2021 to $10.4B. KLA’s key competitors are ASML, ONTO Innovation, Lasertec Corporation, Applied Materials, Hitachi High Technologies with KLA’s market share being >54% and up by >3% since 2018, that is 4x its nearest competitor.
Other source of market size: As per Maximise Market Research PVT Ltd, Semiconductor Manufacturing Equipment Market is valued at $95.1B in 2021 and is expected to reach $153.5B by 2027 (CAGR of 8.3%).
CAPEX Plan of the big players
KLAC revenue is driven by the investments made by the key players such as TSM 0.00%↑ , INTC 0.00%↑ , Samsung, Micron Technology, GlobalFoundries etc. Considering that TSM and Samsung are two main clients with Intel potentially being one of them but not >10%, we expect KLA to benefit from the CAPEX plans described below.
A) TSM’s expects a jump in CAPEX by c.40% (from $30B in 2021 to c.$40-$44B in 2022). It shall be noted that for the first two quarters of 2022 TSM already spent $16.7B and announced in the recent call (Q2’22) that some of their CAPEX will be pushed to 2023, thus it is expected to close the year at the lower end of their guidance i.e. $40B.
TSM back in April 2021 committed in investing $100B over three years to ramp up production of its cutting-edge silicon wafers, but in the recent call, management was reluctant to comment any further for 2023.
The cautiousness for CAPEX beyond 2022 could be a short term headwind to KLAC’s growth but not a real threat to the long term trajectory of TSM CAPEX spending and eventually to KLAC’s growth.
B) Samsung, the leading memory supplier and TSMC’s largest foundry competitor, announced in August 2021 that it will spend $205B over the next three years to bolster its semiconductor and biotech businesses. Samsung spend around 20.3 trillion won (c. $15B) in the first half of 2022 and over Q2’22 call the following was stated:
Foundry, at least we think that the demand will remain solid, especially around the advanced nodes. And so our plan is to continue our investments by analyzing multiple factors, including mid- to long-term market, global customers demand, economic outlook, profitability so that we're able to continue a stable supply.
The above confirms that the strategy is intact and any short term changes in CAPEX plans due to the current economic environment are nothing more than short term.
C) Intel announced in Mar-21 its plans to spent a) $20B on two new chip plants in Arizona and was recently announced (Aug-22) that together with Brookfield Infrastructure Partners, BIP (49%) they will jointly fund $30B for this expansion, b) $20B on two fabs in Ohio (Jan-22), c) a €17B mega site in Germany and a €12B foundry expansion in Ireland (Mar-22) and d) a total of €80B in Europe over the next decade.
Although, Intel’s net CAPEX forecast for 2022 was reduced from $27B to $23B as per the latest quarter (Q2’22), the recent agreement with BIP shows that Intel will not necessarily reduce investments but rather tries to execute on its smart capital strategy. Such developments along with the CHIPS Act (for which Intel is expected to be a key beneficiary) demonstrate that the long term CAPEX investments are likely to happen.
As Rick Wallace, KLAC’s CEO mentioned in the latest earnings call
In foundry logic, simultaneous investment across multiple nodes remain a tailwind. In memory, even with some customers’ investment signaled to slow, demand diversification remains strong across multiple other industries.
Other source -> STMicroelectronics and Global Foundries to build new chip plant in France
3. Leadership and Culture
Culture and Third party reviews
Despite not having significant insider ownership structure (<1%), the majority of the executive management team have long tenures in the Company showing a culture of ‘growing within’. For example, Rick Wallace, President and CEO started his career in KLAC back in 1988 as an applications engineer, Bren Higgins, CFO joined in 1999 and Ben Tsai, CTO (holds 50 patents in areas of inspection and metrology) has over 35 years of experience in KLAC and was named as CTO in 1994.
The ‘growing within’ culture and the ability of KLA to retain its talented employees is also reinforced by the comment made by Rick Wallace, CEO on the Investor day
85% of our Vice Presidents were promoted from within.
A negative observation was the increase in employee turnover ratio for FY22 to 7.4% compared to 5.6% for FY21. At first glance this is worrisome but considering the ‘Great Resignation’ and the fact that full time employees increased from c. 11,300 to c. 14,000 we will assign less weight and keep it under our radar.
While preparing this write-up at various times we checked on Glassdoor for any changes in the scoring metrics of the Company. Within a month there was a slight decline in all metrics (i.e. from 4.1 stars to 4.0, from 91% CEO approval rate to 90% etc.) mainly due to employees feeling that the environment is fast paced and stressful and there is ‘no proper’ onboarding of new hires.
Although not optimal, the scoring is similar to competition and therefore it will not put us off. For example, Lam Research and ASML rank better with 4.2 / 4.1 stars and 94% CEO approval rate, AMAT has similar scorings whereas ONTO (77 reviews) scores only 3.3 stars with 55% CEO approval rate.
Compensation
The Executives compensation comprises of Base Salary, Bonus plan (short term), Performance Restricted Stock Units (“PRSU”) & Restricted Stock Units (“RSU”) (long term) and other compensation (not significant).
As per Morningstar the compensation of Rick Wallace in FY21 was $13.1M of which $9.4M are restricted stock awards and $2.9M non-equity [bonus] compensation. The long term plans (PRSU & RSU) are tied to stock price and to free cash flow (“FCF”) margins relative to its peer group whereas the short term plan is based on operating profits and adjusted by a scaling factor based on revenue, productivity (operating margin), market leadership/share, product differentiation (gross margin) and talent retention.
We are pleased with the compensation structure, which as evidenced by the results, it aligns Management with Shareholder’s interests (more details in section 6 -> comparison of Gross margins, operating margins, FCF margins with KLAC’s peer group and market shares).
Rick Wallace, CEO On the governance, we're pretty focused on the 1 thing you're going to hear a lot today, management compensation. Our long-term equity, everybody is going to present, is tied to free cash flow. That's the metric that we use relative to free cash flow. So when you see Bren talk about it, when we talk about it, it's not an accident. And we didn't get told that. We believe that, that's a metric that free cash flow is a thing that we ought to be measured on as a relative basis to revenue and that informs a lot of our decision-making about profitable growth.
Additionally, per Simply Wall Street, CEO’s total compensation is slightly above the average of US companies with similar size (c. $12.9M) and his compensation has been consistent with the Company’s performance.
Track Record
Another positive attribute of Management is the ability to execute and deliver results by consistently beating or meeting analysts’ expectations in the last 10 years (only a handful of misses).
Not only Management executes on a Quarterly basis, but also surpassed its targets set on 2019 Investor Day, as KLA grew faster than the 7-9% CAGR anticipated, gained 3% market share, strengthened its services division (CAGR of 14%) and returned more capital to shareholders (>80% compared to targeted >70%).
4. Financial Analysis
Profitability
This section compiles the key financial data of $KLAC for the period FY12 to FY22 (unless otherwise stated).

Source: Seeking Alpha, StockOpine analysis
Revenues and Gross Profit (“GP”) CAGR of 11.25% and 11.8%, respectively.
Average GP margin (“GPM”) of c. 60%, one of the highest GPM in the industry. As per Management, pricing is based on value provided to customers and not on a cost basis.
As per Bren Higgins, EVP and CFO, the acquisition of Orbotech which added about $1b in revenues had a dilutive gross margins compared to the average of 2019, however, the company leveraged its operational competencies, technology and customer engagement thus improving margins over time.
Operating income CAGR of 13.6% with an average margin (“OPM”) of 32%. The company had a hit in FY19 mainly due to Orbotech acquisition but subsequently picked up and reached 39.6% by FY22.
Net income CAGR of 16.0% with an average margin of 23.5% reaching 30.0% in FY21 and 36.1% in FY22. The FY22 margin was affected by an abnormally low effective tax rate of 4.8% (non-recurring tax benefit), whereas under normal conditions Management expects an effective tax rate 13.5%. Had the tax rate being 13.5%, the margin would have been c.33%.
Average FCF / Sales of 27% growing from 22.4% in FY19 to 32.6% in the FY22.
Having a growing Services BU (Q4’ FY22 was a record quarterly revenue and surpassed $0.5B) with recurring revenues offers better visibility to future cash flows. As Bren Higgins, EVP & CFO commented about services “an anchor for us in terms of cash flow and cash flow predictability” and explained that most of KLA’s investments are in terms of Working Capital (“WC”) rather than CAPEX and thus they can control it during contraction environments.
Per our calculations the Return on opening Invested Capital (ROIC) averages at 62.6% and is well above the cost of capital of the Company.
In terms of profitability per share, Diluted EPS portrayed a CAGR of 17.3%.
Capital Returns & Cash Position
Dividends CAGR of 15% since 2006 (excluding the special dividend of $16.5 paid in Dec 14) with FY22 pay-out ratio of around 19% and a forward yield of c. 1.4%. The recent dividend increase (24%) represents the 13th consecutive annual increase and Management guided for a continuous increase in the mid-teens (depending on revenue CAGR and earnings leverage).
The Company increased its committed capital return (through dividends & repurchases) ratio from >70% FCF to >85% and announced a $6B share repurchase with $3B in Accelerated Share repurchase (3-6M) and the rest within 12-18M. Bren Higgins, CFO
It's programmatic. We can be opportunistic when we need to be to ensure that we're buying below VWAP, which is usually our goal. And it starts with the principles I talked about before in terms of how much cash you need, what you're going to generate and then putting every dollar to work.
The healthy dividend history and the investment grade credit ratings (Fitch and S&P ratings were recently upgraded) add comfort on the Company’s ability to pay dividends in the future. Rick Wallace, CEO also affirmed at the Investor day the Company’s ability to withstand any downturn and maintain its dividend.
During FY’22 a total of $5.52B (or c.10% of market cap) were returned to shareholders with $3.67B returned in the last quarter ($3.47B share repurchases and $158M dividends). The remaining amount available for repurchases stands at $3.2B.
Cash and marketable securities as of 30 June 2022 amount to $2.7B Vs total Debt of $6.7B.
Although this relationship may not seem ideal, it shall be noted that the $3B were issued in Q4’22 so as to fund the repurchases. Of those $3B, $1B matures in 2032, $1.2B in 2052 and $0.8B in 2062. When compared to FCFs of c. $1.6B in FY20, c. $2.0B in FY21 and c. $3.0B in FY22, one can understand that the risk of missing on its debt repayments is minimal.
Overall, we are convinced that KLA financials make a good story and demonstrate the resilience of KLA Operating model as well as Management’s ability in creating value for the shareholders. After all, the numbers don’t lie.
Outlook
A business is attractive when the long term outlook is attractive and when Management’s vision aligns with shareholders.
Before digging into the long term targets beyond 2022, it shall be noted that the Company has $13.1B (1.4x its FY22 revenue) remaining performance obligations (of which 40%-50% are estimated to be recognized beyond the next 12 months) and Management expects to continue seeing demand growth outpacing supply in the near future.
The below analysis refers to Calendar Years (“CY”) rather than FY as this was the approach followed by Management on its Investor Day.
2026 Targets of KLA

Source: KLA Investor Day 16th June 2022 presentation
Higher growth rates are expected for the Company compared to the targets set in 2019 (which were easily achieved) with a targeted revenue of $14B +/- $500M (FY22 of $9.2B) and $38 +/- $1.5 (FY22 $21.92) Diluted EPS in 2026. This represents revenue CAGR of 9-11% and Diluted EPS CAGR of 14-16% for CY21 to CY26 period.
The growth is mainly expected to be derived organically and through market share gains as only $250M of the potential growth were attributed to M&A activities.
The growth trajectory starts from $8.2B in CY21 and adding $3.6B from Semi PC, $0.7B from EPC, $1.5B from services and $250M from M&A to reach $14B.
Semi PC from revenue of $5.4B in CY21 to c. $9B by 2026 based on Semi PC CAGR of 10-11%, higher than the expected WFE industry CAGR of 7-8% due to share gains.
EPC from revenue of $0.95B (systems only) in CY21 to c. $1.65B by 2026 based on EPC CAGR of 11-12%, higher than the expected market growth CAGR of c.5.5%, mainly due to automotive specialty, advanced packaging and display share gains.
Service revenues are expected to exceed $3B by 2026 (CAGR of 12-14%), from $1.8B in CY21 to $3.3B in CY26 with $1.3B coming from Semi PC and $0.2B from EPC. It is worth noting that the $1B in service revenues took 40 years and Management expects to achieve the 2nd billion this year (after 4 years) and the 3rd billion 4 years later in 2026.
Services as per Bren Higgins, CFO are dilutive to Gross margins but accretive to operating margins because fixed costs are limited. Despite the dilutive impact, since CY16 incremental margins on the services growth are less of a headwind (c.60%+ on average).
Profitability wise the Company aims for a Non-GAAP GPM of 63% (average of last 5 CY was 62.5% and 62.8% for CY21) but there is work to do given the current cost pressures (suppliers, inflation, labor cost, infrastructure investments etc.), a slight leverage on R&D to reach 13% of revenue (historically around 14-15%) as KLA needs to continue invest and expects reasonable savings on selling, general and administrative (“SG&A”) to reach 8% of revenue (historically 10-12%) reaching an Operating Non-GAAP margin of c. 41%-43% (average of last 5 CY was 37.7% and 41.7% for CY21).
On CAPEX, Bren Higgins, CFO mentioned that capital intensity is rising and semiconductors are rising faster than GDP and also commented that he expects $300 million CAPEX in 2022 as they expand footprint around the world to support the demand going forward.
Based on the above, Management expects a low to mid-30s free cash flow margin exceeding all prior years.
Overall, Management expects a revenue 9-11% CAGR (higher than the expected WFE growth rate of c. 7.5%) and 1.5x earnings leverage, which is 1.5x the revenue growth in terms of earnings growth.
Capital allocation wise the key difference from prior years is the projected reduction in acquisitions from 22% of total capital to modest 4% and the doubling of share repurchases (from 22% to 41%). As Brian Higgins, CFO noted
We're going to fund our R&D. We're going to invest in working capital. We're going to enable inorganic opportunities when they present themselves, and we're going to invest the necessary CapEx to support our growth, and we're going to return everything else.
This concludes the first part of our KLA deep dive! Next week we will be releasing the second and last part of our write-up that will include Risks, Competitive Positioning, Opportunities, a high level DCF calculation and our Remarks.
Disclaimer: The team does not guarantee the accuracy or completeness of the information provided in the newsletter. All statements express personal opinions based on own financial and business analysis. Any estimates or forward looking statements made are inherently unreliable. No statement of opinion is an offer or solicitation to buy or sell the financial instruments mentioned.
The content of our newsletter is not a trading or investment advice and we do not provide any personal investment advice tailored to the needs of any recipient. The information provided should not be considered as a specific advice on the merits of any investment decision. Securities trading involve risk and you might lose your capital and/or incur other damages. Investors should make their own research and consult their registered investment advisor or financial advisor before taking any investment decision.
Neither the team nor any of its affiliates accept any liability whatsoever for any direct or indirect loss however arising, from any use of the information contained herein. Any unauthorized copy of this newsletter or its contents is illegal.
By subscribing / reading our newsletter or any affiliated social media accounts, you indicate your unconditional acceptance to the above and your unconditional acceptance to our terms and conditions.
We have a long position in the shares of KLAC.
Congratulations on this deep breakdown of the company, very well explained. For sure one can understand the whole business and it's good perspectives coming forward!
Best regards!