Company Profile
The below write-up is a snapshot of Meta Platforms ($FB) business, financials and valuation.
Family of Apps
Facebook
Instagram
Messenger
WhatsApp
Reality Labs
Reality Labs -> Augmented and Virtual reality products -> Hardware, software and content.
The Company’s main source of revenue is advertising. The key enabler of revenue is the reach that the platforms provide to marketers i.e. the number of active users on Meta’s family of apps. The number of users drives the number of ads that can be delivered as well as the value of ads to marketers.
Meta’s Family of Apps had 2.82 billion daily active users on average for December 2021, an increase of 8% year-over-year and monthly active users of 3.59 billion as of 31 December 2021, up 9%. However, the growth of active users is decelerating given the size of its user base. Deceleration of user growth and potential decline in the number of users is one of the main risks surrounding Meta but on the other hand it makes sense, as the estimated number of people who have used the internet in 2021 surged to 4.9 billion (Data from International Telecommunication Union).
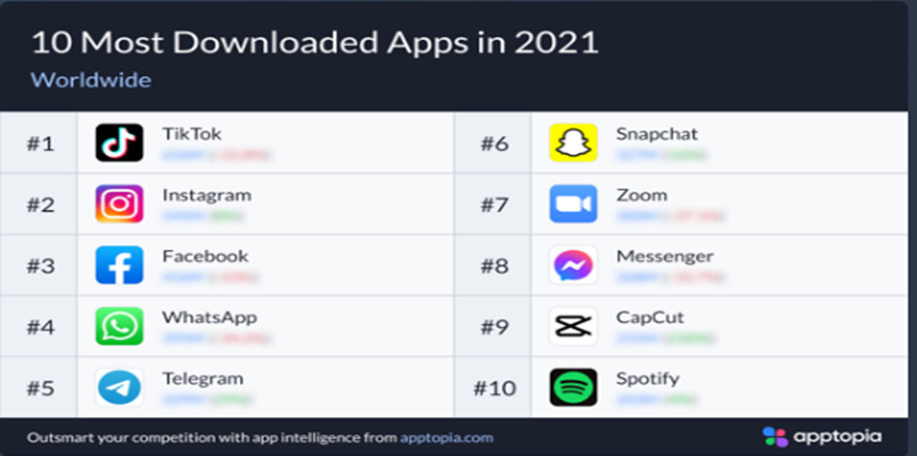
In 2021, Meta’s Family of Apps were in the top ten most downloaded Apps as per Apptopia’s 2021 report.
FB Stock 25/2/2022
Financial highlights
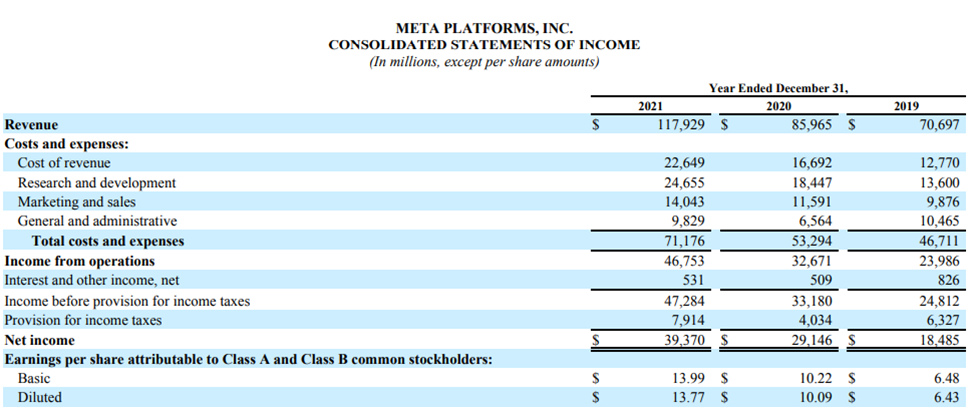
Revenue for the year 2021 grew 37% to nearly $118 billion.
Operating income for 2021 was $46.8 billion, representing a 40% operating margin versus $32.7 billion in 2020, representing a 38% operating margin.
Diluted EPS for the year 2021 was $13.8, up 36%.
Cash and cash equivalents and marketable securities were $48.0 billion as of December 31, 2021 and the Company had no debt. Lease liabilities as of December 31, 2021 were $13.9 billion.
Cash provided from operating activities was $57.7 billion in 2021, up 49%.
FCF was $38.4 billion in 2021, up 67% and 32.5% of revenue.
Capital expenditures, including principal payments on finance leases, were $19.24 billion for the year 2021 and $15.72 billion for the year 2020.
The Company repurchased $44.81 billion of common stock during 2021.
Outlook
For Q1 2022, the Company projects revenue in the range of $27-$29 billion which represents 3-11% year over year growth. The weak guidance provided for Q1 2022 is one of the reasons the stock price fell by 37% since the start of the year. Management highlighted headwinds from increased competition, shift of engagement from feed and stories to reels (short form videos like TikTok) as well as ad targeting and measurement headwinds from platform and regulatory changes due to iOS changes.
Competition
Meta’s competition comes from social media platforms as well as companies that sell advertising to businesses.
Competitors -> Alphabet (Google and YouTube), Amazon, Apple, ByteDance (TikTok), Microsoft, Snap (Snapchat), Tencent (WeChat), Twitter.
Meta has the largest user base relative to its competitors.
The competition in the space is increasing with TikTok growing its user base rapidly (i.e. from 689 million monthly active users in July 2020 to 1 billion by September 2021, up 45%) gaining momentum against Facebook and Instagram. It shall be noted, that the absolute growth in Family Monthly Active People, grew from 3.14 billion in Q2’20 to 3.58 billion in Q3’21.
Mark Zuckerberg, CEO “People have a lot of choices for how they want to spend their time and apps like TikTok are growing very quickly. And this is why our focus on Reels is so important over the long-term”.
The Company’s response to competition from TikTok was the introduction of Reels (short form videos). As per management Reels is the biggest contributor to engagement growth on Instagram and it’s growing very quickly on Facebook.
Competitive advantages, Opportunities and Risks
Competitive advantage
The number of active users creates Meta’s competitive advantage over other social platforms. The Company has the largest user base creating one of the strongest network effects ever seen. The larger the user base the larger the advertising budgets allocated to the platform. The user base also attracts small businesses which use the Company’s commerce tools to sell, promote and advertise on Meta’s platforms. Additionally, the social connections established on Meta’s family of apps can retain the number of users within the Family of Apps and even attract new ones.
Risks
Decline in number of active users due to competition which will in turn result in reduction of advertising spending on the platform.
Reduction in advertising budgets allocated to Meta’s Family of Apps (i.e. due to supply chain issues) or due to failure of the company to deliver suitable Return On Investment for advertisers.
Recent changes in iOS reduce the ability of the Company to target and measure advertising, which has negatively impacted the size of the budgets marketers are willing to commit to the platform. The changes in iOS do not affect only Meta, as other advertising platforms were affected as well.
The Company is promoting Reels which is a feature competing with TikTok, however, Reels are not currently monetized at the same rate as Feed or Stories. There is a risk that the Company will not be able to monetize Reels in the future at the same level as Feeds and Stories.
Operating margin contraction and high CAPEX due to investments in AR and VR as well as investments in Reels. Investments in Reality Labs reduced operating profits in 2021 by $10 billion and such investments are expected to increase in the future. If those investments do not pay off, the Company will incur significant losses.
Opportunities:
Increase of average revenue per user (ARPU) outside US. In Q4, ARPU in US was $60.57, EU $19.68, Asia-Pacific $4.89 and ROW $3.43. Meta’s opportunity is to increase ARPU outside US over time.
Meta can obtain a first mover advantage in Virtual Reality (VR) and Augmented Reality (AR). As per Statista, the global Augmented Reality, virtual reality, and mixed reality market is forecast to reach 300 billion U.S. dollars by 2024.
Valuation
In the below table we are comparing Meta’s valuation multiples relative to other big tech players. Even though we are not comparing apples to apples, we observe some similarities in terms of margin profiles. The closest comparable company is Google which mainly generates revenue from advertising.
In terms of P/E, EV/Sales and EV/EBITDA the Company has the lowest multiple compared to other big tech players and relative to its own 5 year average. Even though Meta is trading at lower multiples, its EBITDA margin is in the top range. It should be noted that Meta’s EBITDA margin is expected to decline in the short term due to a) the Company’s investments in the Metaverse, b) transition from feed and stories to Reels, and c) headwinds from iOS changes.
In the long run, there is a potential for multiple expansion, if either the Reels monetization or Metaverse transition turns out to be successful.
Back-of-the-envelope valuation
We will assume that Meta’s Free Cash Flow for 2022 is $30 billion ($60B EBITDA minus $30B CAPEX), a decrease of 23% compared to the FCF of 2021. Assuming that Meta can at least grow its FCF of 2022 by 3% p.a. in perpetuity and assuming a cost of capital of 8%, results to an EV of $600 billion, well above the current EV of $539 billion.


