

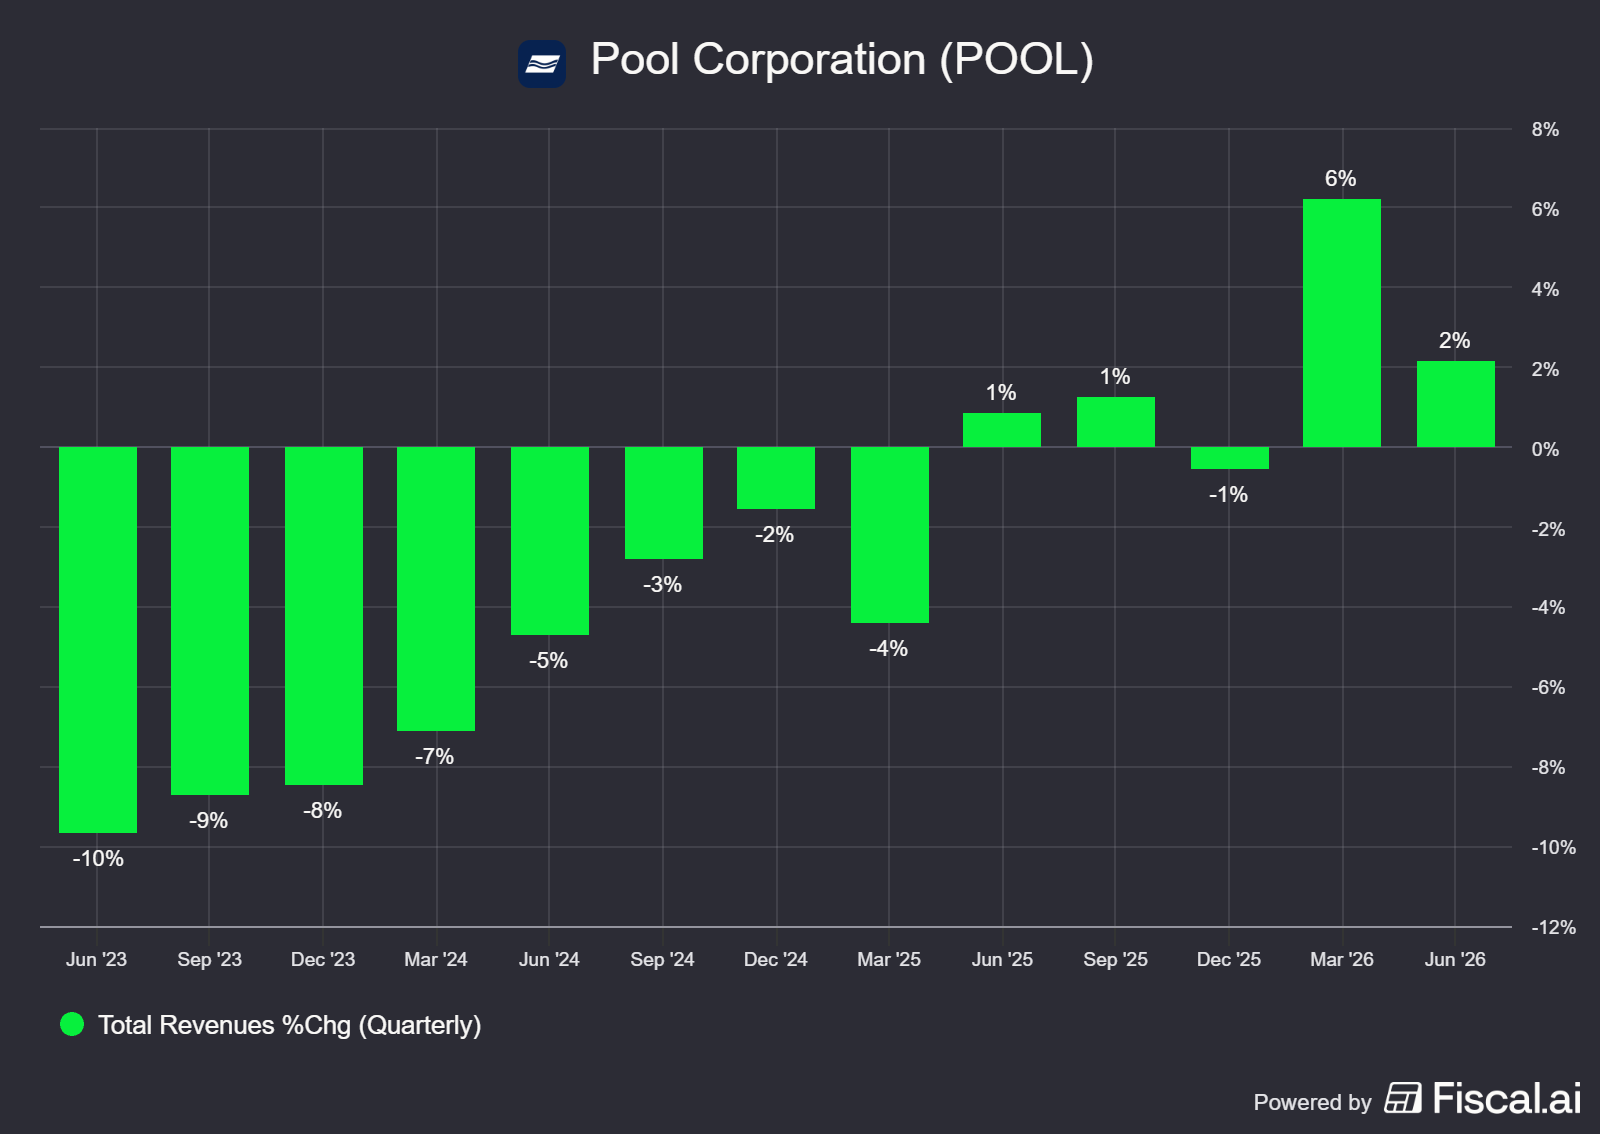
There were no major surprises this quarter, with momentum remaining consistent with the end of Q1'26. The results surpassed bottom-line expectations, while revenue came in line with estimates. Net sales increased 2% to $1.82 billion in the second quarter of 2026. Diluted EPS remained flat year-over-year at $5.17, but when adjusting for CEO transition costs, adjusted diluted EPS increased 4% to $5.38 versus the $5.34 expected.
This quarter confirmed that the installed base is a highly reliable growth driver, while the discretionary side of the business continues to face macro headwinds. Here is our analysis of the latest earnings.
1. Revenue
The 2% top-line growth was supported by steady demand for maintenance products and continued improvement in building materials.
Source: Fiscal.ai (affiliate link with a 15% discount for StockOpine readers)
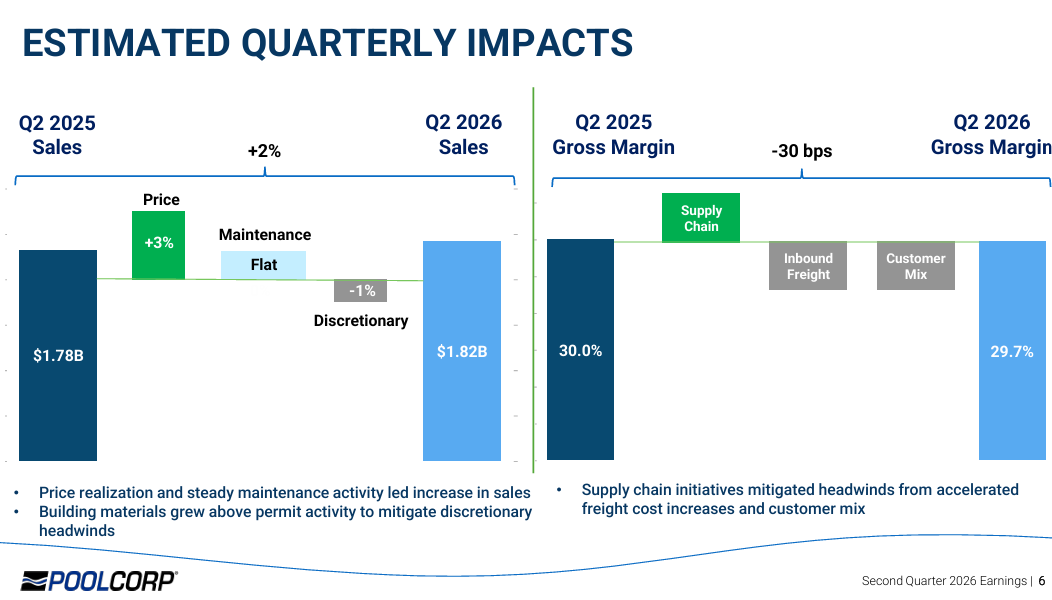
Breaking down the growth, the quarter benefited from a 3% contribution from pricing and flat volume in the maintenance category. This was partially offset by a 1% decline in discretionary volumes.
Source: Pool Corp Earnings Presentation Q2’26
While there was a deceleration from the 6% growth seen in Q1, it is important to remember that Q1 is generally a small, pre-season quarter. In Q1'26, Pool's growth benefited from a 1% carryover from mid-season price hikes implemented in late April of 2025. Those price increases have now lapsed. Additionally, the prior quarter saw 2% volume growth, which was likely driven by early-buy incentives.
2. Gross Profit Margin
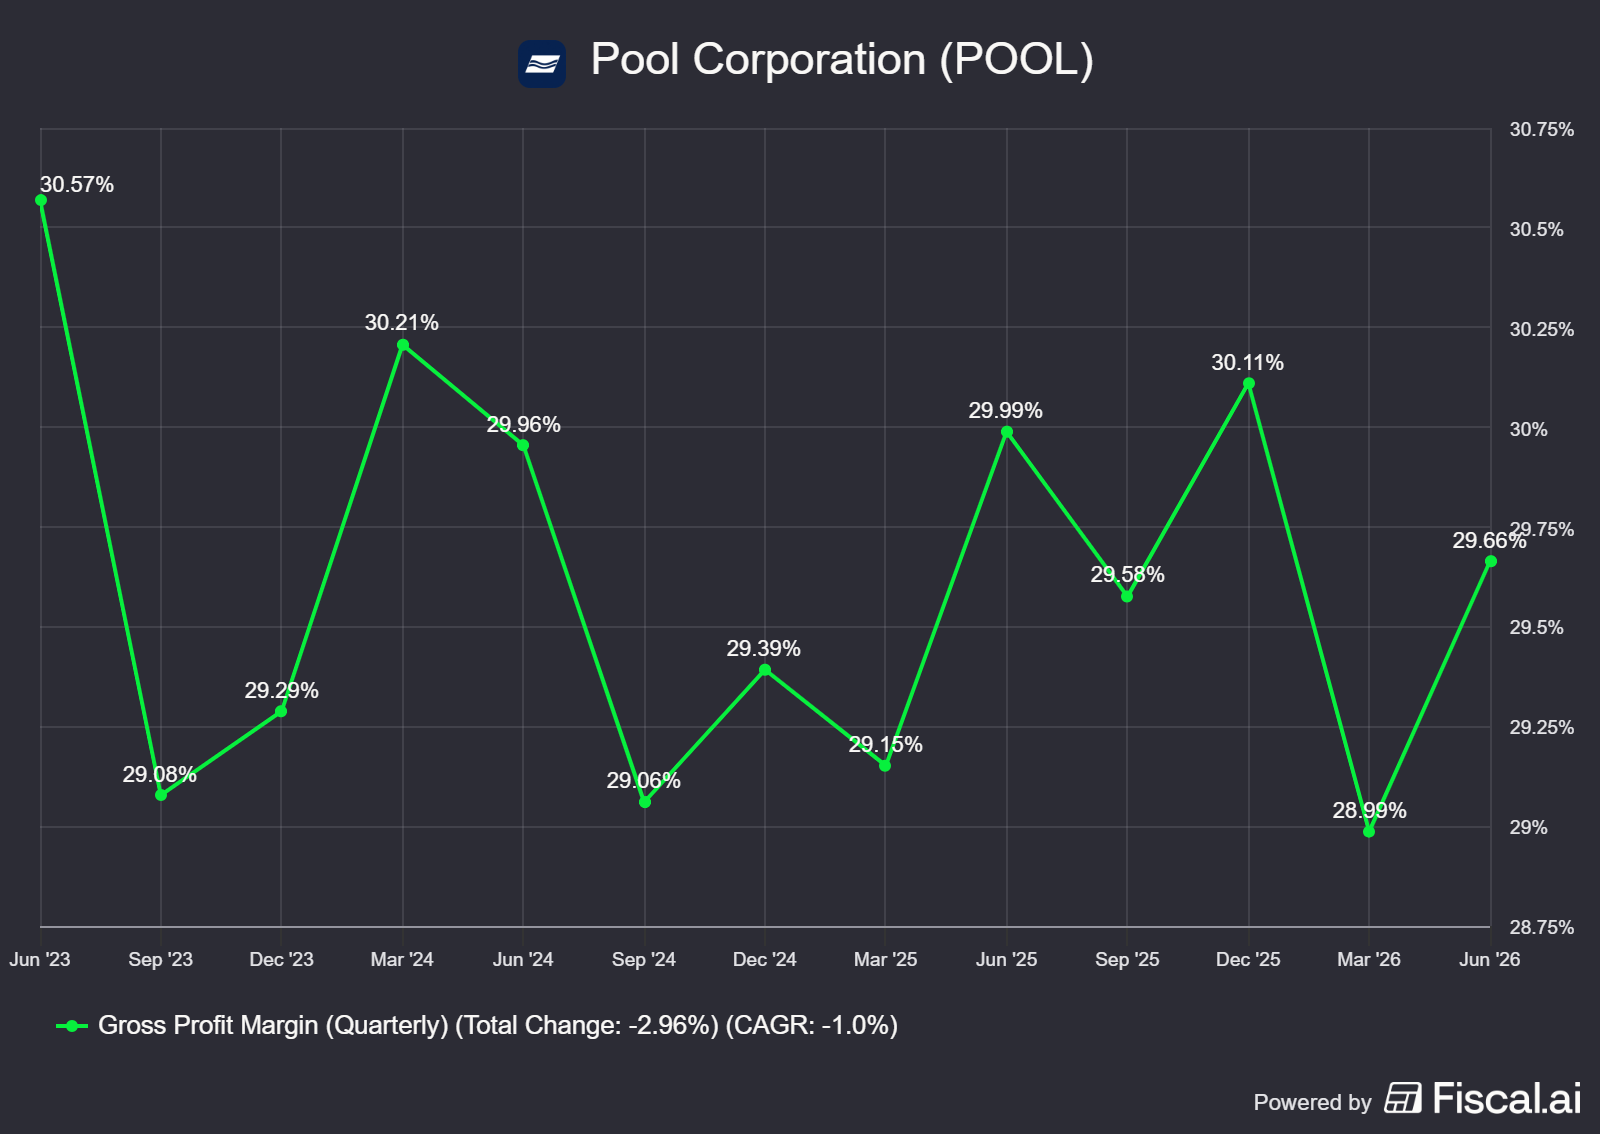
While gross profit dollars increased by $5.6 million to $540.8 million, the gross margin percentage contracted by 30 basis points year-over-year to 29.7%.
The margin dilution was primarily driven by elevated inbound freight costs (driven by the increase in fuel prices) that the company could not fully recoup in selling prices during the quarter, along with an unfavorable customer mix as a higher portion of sales came from larger customers. Higher amount of roll-ups in the pool maintenance industry is not beneficial for Pool as those larger customers can exercise more purchasing power as they become larger. Despite this, the pro pool maintenance industry is still significantly fragmented. Also, when the pool construction turns around, many of the small players who exited during the downcycle they will probably come back in, ultimately reversing those dynamics. These headwinds were partially offset by ongoing supply chain optimization initiatives and the continued expansion of private label and proprietary products which carry higher margins.
Source: Fiscal.ai (affiliate link with a 15% discount for StockOpine readers)
3. Operating Margin and Potential Efficiencies
Operating margin on an adjusted basis was 15.1%, as adjusted operating income grew 1% to $275.9 million. Reported operating expenses increased 4% to $273.1 million, but this included $8.3 million in CEO transition costs, which primarily consisted of non-cash share-based compensation.
When excluding those transition costs, adjusted operating expenses were tightly managed, increasing only 1% to $264.8 million. Management expects operating expenses to increase 2% to 3% for the full year, indicating continued cost discipline and a clear focus on capacity absorption.
4. Performance by Product Category
The Q2 product mix provided clear signals on consumer behavior:
Building Materials: Sales grew 4%. This outperformance reflects the success of National Pool Trends showrooms and indicates that the company is actively gaining market share in a muted discretionary market.
Chemicals: Sales declined 2%, significantly lower than the 8% growth seen in Q1’26, driven entirely by lower pricing. This was the most surprising metric of the quarter, as we have expected chemical pricing momentum to remain positive. Management did not provide specific commentary to explain this.
Equipment: Sales grew 3%. This growth was driven by pricing actions and solid repair-related replacement demand.