

Every month we share 2-3 write-ups on companies we decided to examine as potential additions to our portfolio. Although the companies analyzed may tick most of the boxes, if the margin of safety is not considered sufficient, we will not initiate a position but rather monitor the stock.
At the end of each write-up, we will state whether we decided to buy the stock or not. If not, keep an eye to our Quarterly Portfolio Update releases in which we will update you for all the transactions that took place during the latest quarter.
The Company in this week’s write-up is Pool Corporation (Ticker: $POOL), the leading distributor of the pool industry.
“We provide the construction material and the maintenance supplies and the remodeling products required during the entire existence of each pool, whether it is a DIY maintained pool or one that is serviced by one of our professional customers. It is an annuity industry and business model that grows upon itself as more pools are built or products are demanded forever.” Peter Arvan, CEO.
1. Key Facts
Description: Pool Corporation (“POOL”, “Pool”, and “Company”) is the world’s largest wholesale distributor of swimming pool supplies, equipment and related outdoor living and irrigation products. As of 30 June 2022, the company operated 416 sales centers in North America, Europe and Australia and had over 5,500 employees. POOL operates in a highly fragmented industry, selling products to 120,000+ wholesale customers.
POOL’s value proposition: Purchase products from a large number of manufacturers and then distribute the products to the large customer base on conditions that are more favorable than what these customers could have obtained on their own.
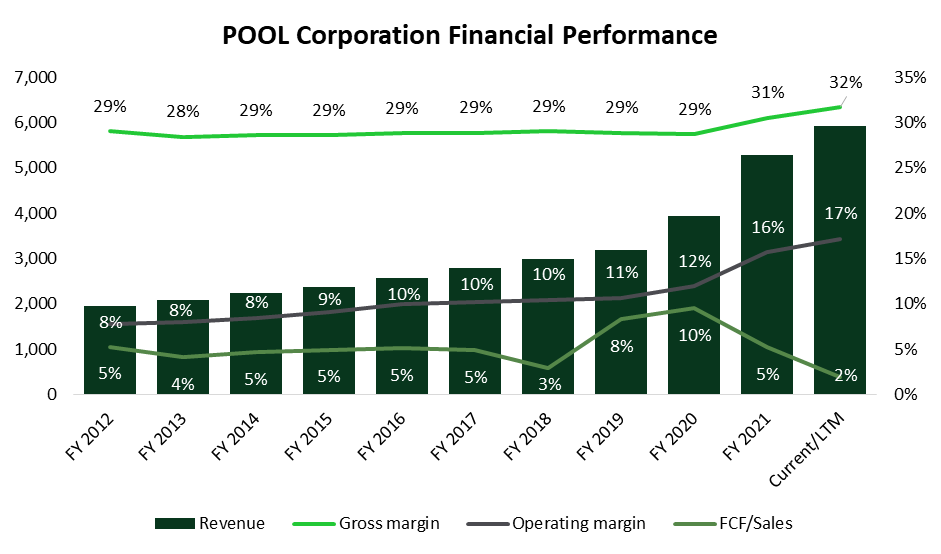
Key Financials: Over the period 2012 to 1H 2022, the Company depicted a Revenue Compound Annual Growth Rate (“CAGR”) of 12.4% reaching a Trailing Twelve Month (“TTM”) revenue of c. $5.9B and generated an Operating Income CAGR of 22.7%, increasing its operating margin from 7.8% to 17.2%, indicating outstanding efficiencies while growing. POOL has a balance sheet with Cash and Short-term investments of $91.5M compared to a debt amounting to $1,595M (excluding leases).
Price & Market Cap (as of 11th October 2022): Its market cap is $12.6B with a 52-week (and all time) high of $582 and a 52-week low of $309, whereas it currently trades at $319, a 45% decline from its all-time high. Pool pays dividends since 2004 and its forward dividend yield stands at 1.25%.
Valuation: Pool trades at an EV/EBITDA of 12.5 (10 Year average of 18.7) and at a TTM P/E of 16.6 (10 Year average of 30.3).
2. History
In 1995, Pool Corporation went public on the NASDAQ under the ticker “POOL”, issuing 4.2m shares at $10.5 per share ($0.92 per share, split adjusted), raising $44million. Revenue in the year of IPO was $161 million compared to TTM revenue of $5.9B.
The Company has been a consolidator in the pool industry, increasing the number of sales centers both organically and by rolling up smaller local and regional distributors. As of October 1, 2021, the Company had 247 reporting units with allocated goodwill balances, giving a sense to the number of small acquisitions that took place. In the last five years alone, the Company opened 32 locations while it acquired 47 locations.
Additionally, the Company has broadened its offering by entering the irrigation and landscape industry in 2005 through the acquisition of Horizon Distributors Inc.
Since IPO, POOL has generated compound average annual shareholders' return of 25%.
3. Business model
Products
POOL sells more than 200,000 national brand and private label products, such as chemicals, supplies and repair parts, pool pumps, filters, heaters and cleaners, commercial and residential irrigation products, outdoor lighting, grills, etc.
Customers
POOL claims to have 120,000+ wholesale customers such as:
Remodelers and builders
Independent specialty retail stores
Service companies
Landscape and irrigation contractors
POOL’s customer mix as a % of total sales includes 80% building and maintenance contractors, 12% retail and 8% other.
Network
As of December 2021, POOL operated through a network of 410 sales centers with the majority populated in higher pool density markets like California (76), Texas (54), Florida (62) and Arizona (26). These states encompass POOL’s four largest markets and represented approximately 53% of POOL’s sales in 2021. POOL also has 149 sales centers in other states and 43 international centers.
In the last five years, POOL increased its number of sales centers from 344 in FY 2016 to 410 as of 31 December 2021 (416 as of 30 June 2022). The plan is to add another 10-12 locations in 2022.
The above locations are divided into 4 distribution networks:
SCP (236 locations) -> Pool’s largest sales center network operating in the US and international, offering pool and related outdoor products
Superior (73 locations) -> offering pool and related outdoor products
Horizon (81 locations) -> offers landscape & irrigation products
National Pool Tile (NPT) (20 locations) -> offering tile, decking materials and interior pool finish products
Suppliers
Pool claims to be sourcing products from 2,200+ product suppliers, however three of those suppliers accounted for 40% of the cost of goods sold in 2021 (Pentair plc – 20%, Hayward Pool Products Inc. - 10% and Zodiac Pool Systems Inc. - 9%).
On the other hand, POOL is Hayward’s largest customer and accounts for approximately 36% of its FY2021 revenue. In addition, POOL is Pentair’s largest customer and accounts for 20% of its total FY2021 sales, i.e., an estimated 50% of Pentair’s pool business.
Can those suppliers exercise leverage over POOL?
Most likely not. We believe that there are strong relationships between POOL and its suppliers and the fragmentation of the consumer base stands to benefit both suppliers and distributors as price increases can pass through the supply chain. For example, POOL saw revenue growth of 22% during Q2’2022 of which 10% was due to inflation impact.
“The inflation that has worked its way into the industry is passing through the channel, which is reflected in our revenue and gross profit performance. We believe that most of the inflation that we are seeing is driven by structural cost increases by our suppliers, making these new price levels permanent in nature.” Peter Arvan, CEO.
Revenue
The Company’s revenue is driven by the construction of new pools as well as from the maintenance and remodeling of the existing installed base. Maintenance and repair accounts for 60% of revenue while new construction and renovation/remodeling account for 20% each.
Maintenance and repair (60% of revenue), grows with the installed base and is regarded as non-discretionary since every pool needs to be maintained throughout its lifecycle. Maintenance revenue is somewhat recurring and thus offers more stability in recessionary periods.
On the other hand, new construction and renovation/remodeling are discretionary in nature and therefore will be the ones affected the most during economic downturns. New pool constructions are positively correlated with the housing market, thus in a period where homeowner’s access to consumer credit is getting limited, we expect that part of the business to deteriorate.
For example, during the Great Financial Crisis, POOL’s revenue in 2008 and 2009 decreased by 7% and 14%, respectively, due to lower pool construction and replacement activity, partially offset by an increase in certain maintenance and repair product sales. As a result, in 2009, maintenance and repair sales mix expanded to 70% of revenue whereas prior to the crisis was just over 50% of total sales.
In terms of geographic mix, 90% of revenue is coming from US, 5% from EU and 5% from Canada & International.
4. Industry
The U.S. Residential Swimming Pool market is estimated to be worth approximately $15 billion, and it is estimated that there are 10.7 million swimming pools in the US of which 10.4 million are residential (6.1 million in-ground, 4.3 million above-ground) and 0.3 million are commercial.
The number of pools is not evenly distributed across states, with warmer states of California, Texas, Florida and Arizona having the most pools. The number of in-ground pools constructed in US in 2021 was 117,000 units, representing an increase of 22% compared to 2020, on top of the 20% growth achieved in 2020.

Source: Pool’s 10K filings, StockOpine analysis
Construction of new pools reached its peak in 2005 and collapsed with the housing market by approximately 80% from its peak levels. Since then, improved economic conditions let to the recovery of new pool construction. On top of that, remote work trends, migration from cities to suburbs and increased homeowner spending on outdoor living spaces boosted construction growth in 2020 and 2021.
Despite the high new construction growth in 2021, the tight labor market was a limiting factor on pool construction and remodeling resulting to strong backlogs as of the end of 2021. However, POOL reported in Q2’2022 that backlogs declined compared to Q2’2021 and we assume that this is demand driven due to recession fears and increases in interest rates.
The average price of an in-ground swimming pool in 2021 was estimated to be approximately $56,000, 17% up from 2020.
In terms of maintenance, homeowners either appoint professional contractors to maintain their pool or do it themselves (DIY customers). DIY versus professional maintenance is estimated to be 50/50.
According to Leslie’s, the average in-ground pool owner spends $800 each year on the chemicals, equipment, parts, and accessories needed to maintain their pool.
Who are the key players in the industry?

Source: StockOpine analysis
Manufacturers (i.e., Hayward Holdings Inc, Pentair plc) – mainly selling to distributors like Pool and specialty retailers like Leslie’s with the majority of the manufacturing sales made to distributors. According to Hayward Holdings, Inc 2021 10K, 78% of residential pool equipment in the United States is sold through specialty distributors such as Pool Corporation, Heritage Pool Supply Group, and Baystate Pool Supplies. Another 12% was sold directly to retailers, and the remaining 10% was sold to builders. In Europe, the sales channel is more direct compared to United States as c. 70% of sales are through distributors and 30% are through direct sales.
Distributors (i.e., POOL Corporation, Heritage Pool Supply Group) - they supply products from the manufacturers to retailers and to the professional channel.
Specialty retailers and mass market retailers (i.e., Leslie’s, Walmart) – selling chemicals, equipment and parts, cleaning and maintenance equipment directly to consumers (DIY consumers).
The below table gives an indication of the size and the unit economics of some of the key players in the industry.

Source: Koyfin, StockOpine analysis
What is the competitive landscape?
POOL Corp mainly competes with regional and local distributors with the majority of them having less than a handful of locations. However, in 2021 a new player entered the market, Heritage Pool Supply Group, a wholly owned subsidiary of SRS Distribution, one of the largest distributors of roofing building materials.
Since entering the market in 2021, Heritage begun rolling up distributors aggressively reaching approximately 100 locations as of today. Heritage got to that size fast through the acquisition of AquaCentral which was the second largest distributor of pool supplies with 65 locations. Even though Heritage is growing fast, POOL is still more than 4x larger in terms of locations.
POOL is by far the largest distributor in the industry; therefore, it benefits from its scale compared to competition. Also, POOL’s long-lasting relationships with manufacturers and professional contractors are further entrenching POOL’s competitive positioning.
5. Strategic acquisition of Porpoise Pool & Patio, Inc.
In December 2021, POOL announced the acquisition of Porpoise Pool & Patio, Inc, the Company’s largest acquisition ever, for a total consideration of $789M. Porpoise Pool & Patio owns two subsidiaries Sun Wholesale Supply, Inc. and Pinch A Penny, Inc.
Pinch A Penny, Inc. is the largest franchisor of pool and outdoor living-related specialty retail stores in the United States with 262 independently owned and operated franchised stores and three owned stores as of Q4’21. Pinch A Penny, Inc mainly operates in Florida where it has 232 stores with the remaining 30 located in Alabama, Southern Georgia, Louisiana, and Texas.
Sun Wholesale Supply, Inc. is a wholesale distributor of swimming pool and outdoor-living products, has a chemical packaging operation and sells products to Pinch A Penny franchisees.
As per management’s commentary in Q4’2021, POOL sees the acquisition as three distinct businesses:
A distribution business that provides supplies to Pinch A Penny franchise stores
A chemical packaging operation that packages and sells chemicals to franchise stores, other distributors and retailers in the industry
A franchisor business
Why do we think that the acquisition is an inflection point for POOL?
Because it is a first step in integrating their supply chain. Through the acquisition, POOL will penetrate the DIY customer segment and will compete directly with Leslie’s, the largest pool specialty store with 952 branded locations.
Management plans to expand the Pinch A Penny franchise store network at rate of 8 to 12 locations per year and during Q2’2022 POOL added one new franchise store, bringing year-to-date new franchise openings to three stores (10 new franchise locations are expected for full 2022).
What will be the financial contribution to POOL?
According to management, Porpoise Pool & Patio operations are expected to add approximately 5% to net sales growth and 5% to EBITDA growth.
On profitability, “Our Porpoise Pool & Patio acquisition will be slightly accretive to gross margins. The distribution business, which is the larger revenue piece held lower margins at our historical rates. However, the franchise revenue will have a positive impact.” CFO, Melanie M. Hart.
If you are interested to read more on the acquisition, we suggest that you read bizalmanac’s write up where he goes deeper on the unit economics and the price paid for Porpoise Pool & Patio.
6. Risks
Increasing interest rates - We expect that the FED monetary policies to fight inflation will ultimately soften the housing market and reduce discretionary spending which will adversely affect new pool construction and major replacement and refurbishment activities. Given that new construction and remodeling/renovation activities account for 40% of total revenue, short term growth is uncertain. However, new construction backlogs as well as the stability of the maintenance and repair business provide some protection to the Company.
Inventory pile up – POOL built inventory throughout 2021 and reached as high as $1.6 billion in Q1’2022 in order to meet demand given the supply chain issues and extended lead times. Even though this will enable the Company to exploit the high demand opportunity, it does come with risks in a period where we might be on the brink of a housing market collapse. Any potential inventory write offs will significantly harm profitability.
Heritage Pool Supply market entry - Heritage entered the industry and reached 100 locations in a very short period of time. Further aggressive strategies by Heritage to grab market share (i.e., large discounts to customers) could harm POOL’s profitability. Even though the threat exists, we believe that the high fragmentation of the consumer base stands to benefit both players who can evolve to a stable oligopoly.
7. Financials
Profitability
POOL depicted a Revenue CAGR of 12.4% for 2012-1H 2022 (“Historic Period”). Gross Profit grew at a similar rate (CAGR of 13.4%) reaching a Gross Margin (“GPM”) of 31.8% (from 29% in 2012), whereas Operating Profit grew at a faster rate (CAGR of 22.2%) achieving an Operating Margin (“OPM”) of 17.2% (7.8% back in 2012).
Source: Koyfin, StockOpine analysis
Per the above graph, Free Cash flow (“FCF”) shows an inverse relationship, with FCF margin dropping from 9.5% in 2020 to 5.2% in 2021 and to 1.9% for the latest 12 months. Nonetheless, this was done consciously by the company as they built inventory to mitigate lead time delays. For example, inventory days (year-end calculation) increased from an average 105 days (2012-2020) to 133 days in 2021.
Melanie M. Hart, CFO, Q4’21 “During 2021, the increased level of industry demand put continued pressure on our supply chain partners, resulting in us electing to build inventory ahead of anticipated sales growth.”
Regardless of this built up, the Company expects a normalization in working capital in the 2nd half of 2022.
Melanie M. Hart, CFO, Q2’22 “As we have seen improved lead times, we would expect to seasonally bring down inventory in third quarter 2022 in order to take advantage of early buy opportunities that we expect to arise as normal in fourth quarter 2022. For the year, we are expecting to generate significant free cash flows.”
Due to the double digit CAGRs, Revenue increased from $2.0B in 2012 to $5.9B in 1H 2022 on a TTM basis, Gross Profit from $567M to $1.9B and Operating income from $152M to $1.0B.
Revenue growth was a result of various elements such as market share gains, inflation, acquisitions, new constructions, product expansion etc. Inflation was key for 1H 2022 growth (10% out of 22%) and is expected to account for the vast of the growth in full 2022. Per the CEO, the inflation is permanent in nature.
In terms of profitability, the jump in gross margin in 2021 (from 28.7% to 30.5%) is mainly explained by inflation, supply chain management improvements and vendor purchasing incentive programs. For 2022, an improved gross margin is expected due to inflation.
Additionally, OPM is growing as a result of the improved customer experience (location, expertise, 24/7 access to tools, inventory availability, call centers, improved transaction time etc.), the Focus Sales Centers programs that aim to get lower profitability centers to Company’s average (minimum margin threshold from 8% to 10%) and Management focus in improving margins as Operating Income is a considerable part of bonus compensation (e.g. 140% of the total 200% bonus part of the CEO).
Peter Arvan, CEO “Because for me to say, hey, look, we're growing, growing, growing. But if I grow the top line, and I'm not creating that operating leverage and the operating margin expansion, then from my perspective, we're just -- we're working way too hard. So it's not one or the other. It's both.”
Balance Sheet
POOL does not have the best financial position, with Cash and Short-term investments of $91.5M (as of 30 June 2022) compared to a debt amounting to $1.8B (incl. leases).
However, considering that a significant part of the debt was drawn to fund the strategic acquisition of Porpoise Pool & Patio, Inc for $788M and given the high EBIT coverage ratio (47.7x for 1H 2022) and the low trailing 12 months Total Debt / EBITDA ratio of 1.6x we do not foresee any financial risk.
It shall be noted that the financial covenants disclosed in 10Q Q2’2022 are easily covered.
8. Capital Allocation
As stated earlier, POOL is an acquirer in the industry, with Goodwill and Intangible asset balances amounting to $693M and $309M, respectively (c. 25% of total assets) with negligible impairments as of 30 June 2022. Being an acquirer carries integration risks and overpayment risks, although POOL has a successful integration story, with high and growing returns on capital and equity.

Source: Koyfin, StockOpine analysis
Nevertheless, the chunk of the goodwill ($403.5M out of $693.0M) and of the intangible asset balances ($301.0M out of $309.4M) comes from the recent Porpoise acquisition, thus the challenge is different this time.
In terms of dividends the company recently increased its quarterly dividend by 25% to $1 per share (estimated yield of 1.25%) representing the 12th consecutive year of growth.
POOL also has an authorized share repurchase program with available balance of $422.8M. In the latest quarter, $216 million in share repurchases were spent, acquiring 547,000 shares (year-to-date total share repurchases of $268 million).
Reduction in the number of shares due to repurchases, growing revenues and improved profitability contributed to the outstanding CAGR of 28.2% in the unadjusted Diluted EPS during 2012-2021 (from $1.71 to $15.97).
9. Valuation
The stock price as of 11th of October 2022 stands at $319.42 and is down by 43.6% YTD. The market cap of POOL stands at $12.65B and trades at an EV/EBITDA TTM multiple of 12.5x. Based on our DCF valuation the estimated price of POOL stands at $361, which is 13.1% higher than the current price level, with a resulting IRR over a 5-year period of 13.2%.

Source: StockOpine analysis
To estimate the fair value of Pool Corporation we assumed a revenue CAGR of 6.1%. Given that 2022 is already halfway and revenue grew by 21.8%, we model 17.8% for the full 2022 which is based on analysts’ consensus. This is also in line with the outlook provided by management for the full year sales growth of 17%-19%. Thereafter, a CAGR of 3.3% is applied which is based on analysts’ consensus and own assumptions. Although the projected CAGR is well below the 12.4% of the Historic Period, we consider the assumptions prudent given management’s expectations of 6%-9% long term growth (as provided during the Investor Day in March 2022).
As a result, by 2026 we estimate to reach a revenue of $7.1B, i.e., a quarter of its estimated addressable market of $28B ($10B Wholesale Pool Products, $7B Irrigation & Landscape, $3B each of the DIY Pool Care, Hardscapes and Europe Wholesale Pool and $2B Commercial Pool).
In terms of profitability, we used an average projected EBITDA margin of 17.4% and a terminal EBITDA margin of 17.7%. Both average and terminal EBITDA margins are higher than the average EBITDA margin for 2018 - 1H 2022 of 13.5%, however, our assumption accounts for a gradual improvement in margins similar to Company’s execution as of today. For example, EBITDA margin increased from 12.7% in 2020 to 16.2% in 2021 and stands at 19.4% for the first six months of 2022 (however the business is seasonal). Per analysts’ consensus, EBITDA margin is expected to drop in 2023 and 2024 at c.17.2%, and for 2025 and 2026, we added 25bps – 30bps p.a.
To derive the free cash flows to the firm we deducted projected Capex requirements of 1% in line with its 5-year average.
In respect to the terminal EV/EBITDA multiple, it is assumed to be around 15.5x which is lower than its 5-year average of 21.3x but higher than its current multiple of 12.5x. The multiple is also higher than the 5-year median and average of other distributors (not in the pool industry) of 12.9x and 14.3x, respectively.
To calculate the value per share we used the minimum required return that we aim to obtain from our investments (i.e., 10%) under the current environment, adjusted for net debt and non-operating assets / liabilities identified and thereafter divided the resulting value by the number of shares. Further to the relatively standard adjustments, we also normalized working capital given the abnormal built up of inventory.
Based on the above calculations and assumptions used (which of course may not materialize at all), we reach a value per share of $361, 13.1% higher than the current price of $319.42 with a resulting IRR over a 5-year period of 13.2%.
Sensitivity analysis
The below table gives an indication of the potential upside/(downside) %age compared to the current price ($319.42 as of 11th of October) when the terminal multiple and the discount rate are changed.

Source: StockOpine analysis
10. Concluding remarks
POOL fits our portfolio for the following reasons:
Leader in a relatively consolidated industry with a fragmented consumer base and strong track record of execution.
Its scale provides POOL with a significant competitive advantage, evident by market share gains and operating margin improvement over the years.
Based on our fair value estimate (which may not materialize at all), POOL trades 13.1% lower than its intrinsic value and provides a potential IRR of 13.2 % for the next five years, meeting our hurdle rate.
We recognize that monetary policy will ultimately impact discretionary spending and will possibly hurt POOL’s new pool construction and refurbishment business. However, we believe that much of the impact is priced in and in case of a recession, we are confident that POOL can get out of it with higher market share.
Based on the above, we allocated 2.5% of our portfolio to POOL and we may consider adding to the position subject to recession developments and price movements.
You can find us at Commonstock and on Twitter @StockOpine.
Disclaimer: The team does not guarantee the accuracy or completeness of the information provided in the newsletter. All statements express personal opinions based on own financial and business analysis. Any estimates or forward looking statements made are inherently unreliable. No statement of opinion is an offer or solicitation to buy or sell the financial instruments mentioned.
The content of our newsletter is not a trading or investment advice and we do not provide any personal investment advice tailored to the needs of any recipient. The information provided should not be considered as a specific advice on the merits of any investment decision. Securities trading involve risk and you might lose your capital and/or incur other damages. Investors should make their own research and consult their registered investment advisor or financial advisor before taking any investment decision.
Neither the team nor any of its affiliates accept any liability whatsoever for any direct or indirect loss however arising, from any use of the information contained herein. Any unauthorized copy of this newsletter or its contents is illegal.
By subscribing / reading our newsletter or any affiliated social media accounts, you indicate your unconditional acceptance to the above and your unconditional acceptance to our terms and conditions.