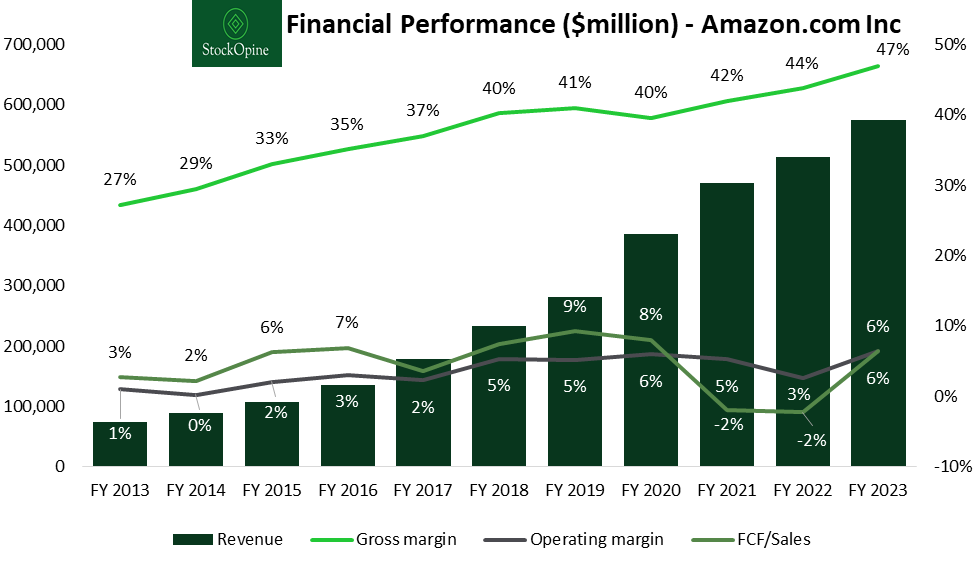
In March 2023, we initiated a 5% position at ~$93 based on our investment thesis, which outlined expectations for improved earnings driven by accelerated ad growth and increased reliance on AWS, resulting in higher free cash flows. This projection materialized in 2023. Additionally, operational efficiencies within the core business played a significant role in boosting margins.
Sponsored by: Borsa: Every earnings call in one app
With earnings season in full swing, we're pleased to share our trusted tool to get through every earnings season. Borsa makes listening to earnings calls as effortless as tuning into a podcast. We love that Borsa is simple yet provides presentation slides, earnings releases, and transcripts along with every earnings call. Check it out -> Borsa
1. Performance
a. High level results
Q4 revenues reached $170 billion, surpassing mid-guidance by $6.5 billion, with a year-over-year growth of 14%. Full-year sales of $574.8 billion, up by 12%.
Q4 operating income of $13.2 billion (margin of 7.8%), surpassing mid-guidance by $4.2 billion, and up from $2.7 billion in Q4'22, with a margin of 1.8%. Full-year operating income reached $36.9 billion, a 200% increase.
Q4 EPS of $1, surpassing the consensus of $0.8 and up from $0.03 in Q4'22. Full-year EPS stood at $2.9 (negative EPS in 2022).
Free cash flow (Trailing Twelve Months, TTM) amounted to $36.8 billion, compared to an outflow of $11.6 billion in 2022.
Source: Koyfin (affiliate link with a 15% discount for StockOpine readers), StockOpine analysis
b. Segmental analysis
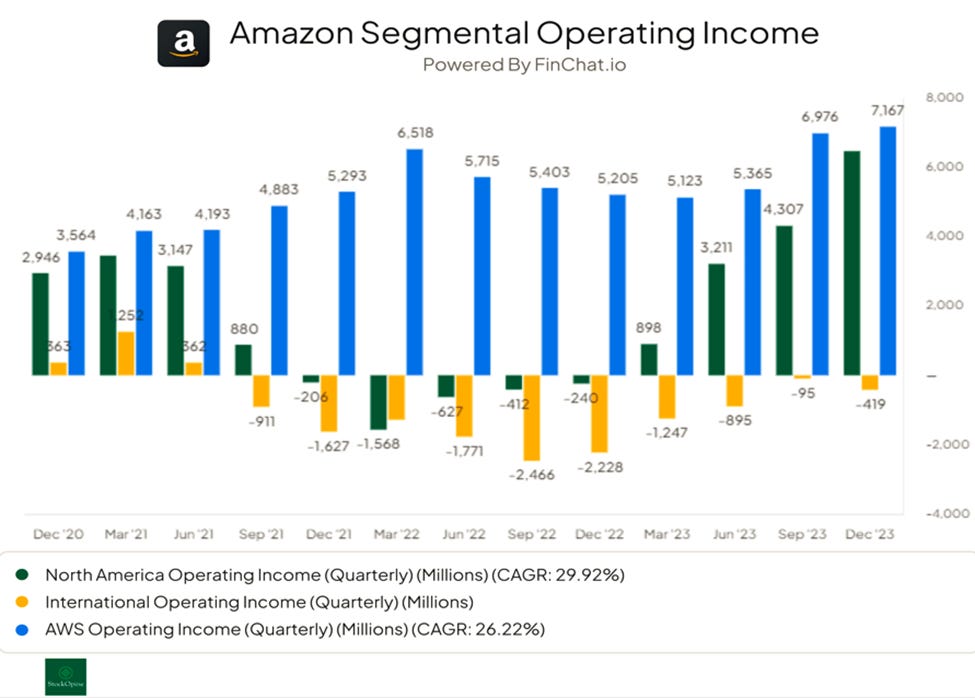
As evident from the data above, both margins and free cash flows have seen improvement. The primary driver behind this enhancement is the North American region, which accounts for 61% of sales and experienced growth at 11.7%—faster than the International segment (11.2%), but slightly slower than AWS (13.3%). North American operating margins rose from -0.9% in 2022 to 4.2% in 2023, contributing $17.7 billion of additional operating income compared to 2022.
Source: FinChat.io, (affiliate link with a 25% discount for StockOpine readers)
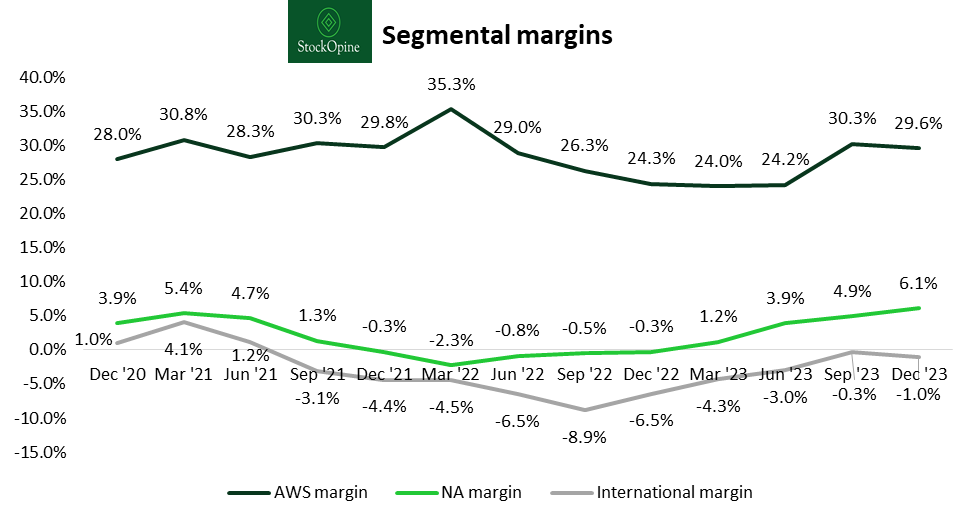
The North American region has demonstrated efficiency improvements, marked by an increase of over 800 basis points in the last seven quarters due to sales leverage, improved inventory placement, reduced costs, and expedited delivery. Moreover, both the AWS and International segments have shown a reversal in their trends, with AWS returning to approximately 30% levels and International losses approaching breakeven.
AWS margin improvement was primarily driven by headcount reductions, while sales growth reaccelerated to 13.2% in Q4’23 (up from 12.2% in Q2 and 12.3% in Q3) due to “the diminishing impact of cost optimizations. And as these optimizations slow down, we're seeing more companies turning their attention to newer initiatives and reaccelerating existing migrations”.
Another promising indicator of AWS reacceleration is the trend of performance obligations related (mainly) to future AWS services. In 2023, performance obligations amount to $155.7 billion, marking a year-over-year increase of 41% and accounting for 171.6% of AWS TTM sales. To provide context, the same ratio stood at 85.1% in 2019. These customer contracts serve as compelling evidence against any notion that Amazon is losing ground.
As per Andrew Jazzy, CEO: “we're now approaching an annualized revenue run rate of $100 billion. We watch the incremental revenue added each quarter, and in Q4, AWS added more than $1.1 billion of incremental quarter-over-quarter revenue, which on an FX-neutral basis, is more than any other cloud provider, as far as we can tell.”
On the international front, in addition to benefiting from fixed cost leverage, lower costs to serve (leading to increased units per box), and reduced transportation rates, strong growth in advertising has also positively impacted margins. Different countries are positioned at varying levels along their profitability path, with promising trends emerging, while Prime membership is anticipated to drive growth.
Source: FinChat.io, (affiliate link with a 25% discount for StockOpine readers)
c. Advertising
Google advertising added $13.4 billion in 2023, representing a 6% increase (reaching $237.9 billion). The Meta Family of Apps, which mainly relates to advertising, grew by $18.6 billion, a 16% increase (reaching $133.0 billion). However, Amazon stole the spotlight, achieving revenues of $46.9 billion, an increase of $8.4 billion or 24%. It's worth noting that growth has accelerated over the last two quarters to 26.3% and 26.8%, respectively, underscoring the quality and returns that advertisers receive.
Source: FinChat.io, (affiliate link with a 25% discount for StockOpine readers)
Over the call, the company announced the launch of Sponsored TV advertising (streaming TV campaigns) in the US, introducing another source of advertising revenue as advertisers tap into its Prime members. This initiative is already displaying positive signs, with significant potential for further growth.
d. 3P Seller Services & Subscriptions
After ads, the fastest-growing segment in 2023 was 3P Seller Services, achieving a growth of 19%. This highlights the attractiveness of the Amazon marketplace and the efficiency of its fulfillment services. Notably, both merchants and customers prefer Amazon due to its fast delivery, which enhances customer satisfaction and increases the likelihood of choosing Amazon over other options.
Additionally, the company reported its first drop in cost to serve per unit since 2018, which, as reflected in the overall results, positively impacted profitability. Management anticipates further enhancements in 2024 through operational optimization efforts and CEO Andrew Jazzy has also expressed the company's ‘ambition’ to surpass 2018 levels in cost-to-serve efficiency over the long term.
A key statistic shared in Q4’23, that emphasizes the quality of service, is that 7 billion items arrived on the same or next day for Prime members.
Source: FinChat.io, (affiliate link with a 25% discount for StockOpine readers)
These benefits for Prime members also translate to higher subscription services, which saw a similar pattern of growth with a 14% increase, reaching $40.2 billion. Speaking of benefits, Andrew Jazzy, CEO, mentioned that
“Throughout the quarter, customers saved nearly $10 billion across millions of deals and coupons, almost 70% more than last year.”
e. CAPEX & Outlook
Capex decreased by $10.2 billion to $48.4 billion in 2023, accounting for 8.4% of sales compared to 11.3% in 2022. This decline was primarily driven by reduced spending on fulfillment. However, looking ahead, management anticipates an acceleration in capex, particularly for infrastructure investments in AWS, including generative AI models.
For Q1’24, management forecasts a year-over-year sales growth of 10.5% (mid-point), while operating income is expected to reach $10 billion (mid-point), reflecting a substantial 108% increase compared to the previous year. It's worth noting that excluding the depreciation benefit resulting from changing the useful economic life of servers, operating income estimate would have been $0.9 billion lower, equivalent to about 0.6% of sales.
f. Gen AI
We don't want to dwell too much on this, as everything is still in the early stages. However, observing all the recent developments that Amazon has unveiled, such as AmazonQ, Rufus – the shopping assistant, new capabilities on Amazon Bedrock, and Amazon SageMaker, alongside the continuous growth in AWS and the introduction of new chips like Graviton4 (providing 30% better compute performance and 75% more memory bandwidth) and Trainium2 (delivering 4x faster ML training for Gen AI applications and already having customers such as Airbnb), along with the enhanced collaboration with Nvidia, demonstrates that Amazon will play a pivotal role in this era.
The 2024 Capex outlook, especially as they expand into generative AI, indicates Amazon's commitment to succeed.
As CEO Andrew Jazzy stated, “it's still relatively small, much smaller than what it will be in the future, where we really believe we're going to drive tens of billions of dollars of revenue over the next several years. But it's encouraging how fast it's growing and our offering is really resonating with customers.”
2. Valuation
The valuation below was primarily based on analysts' forecasts (for revenues & margins), with minor adjustments in cases where we identified ambiguous estimates. The purpose of conducting this exercise in an earnings update is to evaluate whether Amazon is trading on an overvalued territory following its 1-year return of 82.2%.
As of 22nd of February 2024, the stock price stands at $174.6 with a year-to-date return of 14.9%. Amazon’s market capitalization stands at $1.8T and it trades at an EV/EBITDA TTM multiple of 19.2x. Based on our DCF valuation, the estimated price of Amazon is $193, 10.3% higher than its current price, with an expected IRR over the projected period of 12.5%.
Source: StockOpine analysis
To estimate the fair value of Amazon, we projected a revenue CAGR of 10.5% in line with analysts’ expectations, resulting to a revenue of $945.3 billion by 2028. Given the rapid growth in digital advertising, the potential of AWS, the shift from physical to online commerce, and the anticipated impact of Gen AI, we believe that a double-digit CAGR is reasonable.
Regarding profitability, we applied an average and terminal projected EBITDA margin of 18% and 17.7%, respectively. While the average EBITDA margin exceeds the 5-year average of 12.7% and the 2023 margin of 14.9%, we anticipate that Amazon's expansion in high-margin businesses (advertising and cloud), along with decreasing costs to serve and the international segment's move toward positive profitability, supports the attainability of these margins.
To calculate the free cash flows to the firm, we subtracted projected Capex requirements of 9% of revenue, lower than its FY20-FY23 average of 10.1%. However, our starting point accounts for this historical average, which incorporates management's expectation of accelerated Capex in 2024 due to investments in AWS infrastructure. Considering taxes and potential working capital needs, our analysis yields a terminal FCF margin of 9.3%. Looking at the FY18-FY23 average of 7.8% (excluding the high growth phase of 2021 and 2022), gives us confidence that this assumption is not overly aggressive.
In terms of the terminal EV/EBITDA multiple, we assumed a value of 17.3x, which is 10% lower than its current TTM multiple of 19.2x and 22% lower than its 5-year average of 22.2x. One year ago, margin forecasts appeared more cautious compared to today, and considering the potential euphoria and extrapolation in estimates, we chose to discount the current multiple as a ‘prudency adjustment’.
To calculate the value per share we used the minimum required return that we aim to obtain from our investments (i.e., 10%) under the current environment, adjusted for net debt and non-operating assets / liabilities identified and thereafter divided the resulting value by the number of shares.
Based on these calculations and assumptions (which may not materialize), we estimate a value per share of $193, higher than its current price of $174.6, resulting to an IRR of 12.5% over the projected period.
Sensitivity analysis
The below tables give an indication of the potential upside/(downside) compared to the current price ($174.6 as of 22nd February 2024) when a) the terminal EBITDA multiple and the discount rate are changed and b) the terminal EBITDA multiple and EBITDA margin are changed.
Source: StockOpine analysis
3. Conclusion
The quarter and year demonstrated Amazon's solid performance, showcasing the fruition of its investments in fulfillment centers and technology infrastructure. There is ample opportunity for margin and cash flow expansion and we are pleased to see that Amazon's valuation is reasonable.


