

Earlier this week, we published our full deep dive on Grab. Today, we are sharing the industry section as a standalone piece and making it available to everyone. The goal is simple: to give you a clearer sense of how we approach research at StockOpine and what you can expect from our deep dives, how we think about markets, structure, and long-term opportunity. If you find this useful, the full report goes deeper into valuation, segment economics, and risks.
You can find the full Grab deep dive here:

Industry & Market Analysis: The “Digital Decade”
a. The Macro Thesis
GDP Growth: Southeast Asia (SEA) combines scale with growth. The region is already the world’s fifth-largest economy, with GDP of roughly $4.2T, behind only the US, China, Germany, and Japan, and is projected to reach about $5.7T by 2030, implying a ~6.3% CAGR.
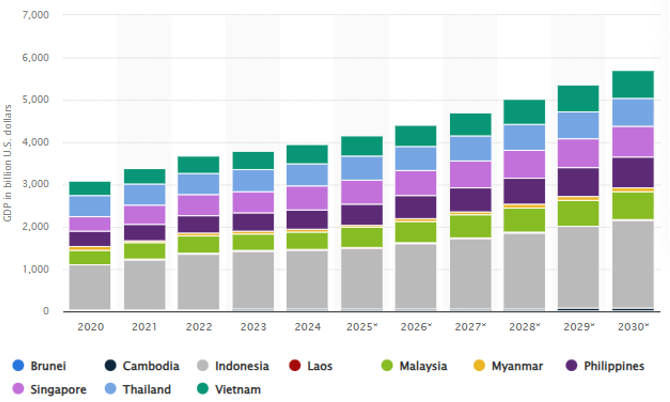
Source: Statista October 2025
Demographics: Unlike aging populations in China (average age of 40) or the West (average age of 45 in EU and 39 in the US), SEA’s median age is ~30 years old. The working-age population is expanding, providing both a steady supply of workers (drivers/riders) and a growing base of “digital native” consumers entering their prime spending years.
Urbanization: Key markets like Indonesia, Vietnam, and Thailand have urbanization rates of 40%–59%, lower than China (66%) or the saturated US (83%). As these nations urbanize, density increases improving unit economics for delivery networks and creating inevitable demand for ride-hailing in congested cities. In essence, more millions are expected to move into Grab’s serviceable areas.
The Digital Opportunity: According to the e-Conomy SEA 2025 Report (Google, Temasek, Bain), Southeast Asia’s internet economy, excluding Digital Finance, is projected to reach $555bn in GMV by 2030, up from $305.5bn in 2025, implying a 12.6% CAGR.
Within this, food delivery GMV is expected to grow from $23bn in 2025 to $36bn by 2030 (9.4% CAGR). While headline GMV growth is moderate, adjacent advertising revenue is expanding at 60–90% rates, which materially changes unit economics (discussed later).
Transport and mobility GMV is forecast to nearly double, rising from $11.5bn in 2025 to $22.5bn in 2030, representing a 14.4% CAGR.
Turning to Digital Finance (payments, lending, wealth, insurance), digital lending stands out. It accounts for roughly 63% of Digital Finance revenue and is projected to grow its loan book from ~$91bn in 2025 to ~$225bn by 2030, implying a 19.8% CAGR.
b. Competitive Landscape
Although Grab faces competition across its markets, it remains the clear market leader in most geographies where it operates.
Food delivery
In food delivery, data from Momentum Works (2024) shows Grab holding ~54% market share, well ahead of competitors. This compares with ~16% for Foodpanda, owned by Delivery Hero SE, ~9–12% for ShopeeFood (owned by Sea Limited), and ~10% for Gojek, part of GoTo Group.
At the country level, competition varies. In Vietnam, Grab competes head-to-head with ShopeeFood, with market shares of 48% and 47%, respectively. In Indonesia, Grab’s second-largest market, Grab leads with ~50% share, compared to ~43% for Gojek. Grab has also strengthened its position outside Indonesia as Gojek has fallen behind in other markets, following its exit from Vietnam in September 2024.
In other markets such as Singapore, Malaysia, and the Philippines, Grab holds majority market shares above 60%, and over 45% in Thailand, based on Momentum Works’ 2023 data.
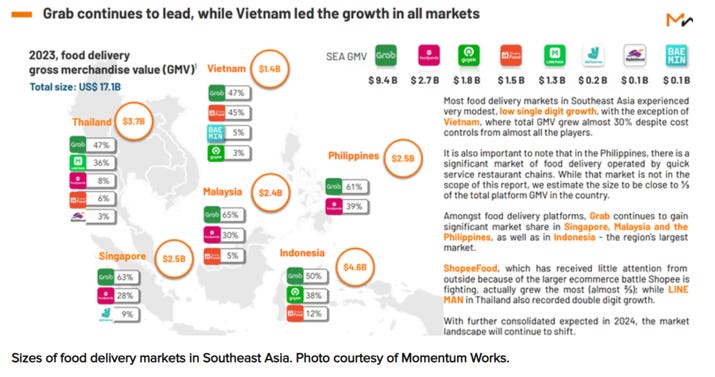
Source: Vietnam spends $1.4 bln on food delivery in 2023, up 30%: Momentum Works
This increasing consolidation supports a shift from cash burn toward profitability, a transition already visible in Grab’s financials. Looking ahead, a potential Gojek acquisition could further strengthen Grab’s position in Indonesia (discussed below).
Ride-hailing
In ride-hailing, a broadly similar picture emerges, with Grab holding leading positions across most of its markets.
In Singapore, Grab is estimated to command ~70–75% market share, with Gojek and TADA competing for the remainder. In Indonesia, the market is more evenly split between Grab and Gojek, although a potential acquisition would push Grab’s share above 95%, effectively consolidating the market.
In Thailand, Grab holds around ~50% share, competing mainly with LINE MAN and Bolt. In Malaysia, various reports point to >90% market share, with the primary risk stemming not from competition but from regulatory pressure related to the Gig Workers Bill.
The more challenging markets are the Philippines and Vietnam. In the Philippines, Grab was previously a ~90% market leader, but a government decision to uncap licenses for foreign-owned operators enabled inDrive to enter and rapidly gain share. Grab’s share is now estimated at ~80–85%. While still dominant, the concern lies in inDrive’s pace of expansion, with reports citing an ~8× increase in rides and ~7× growth in passengers in 2025, driven by its auction-based pricing model and ~10% commission rate, well below the industry norm of 20–25%. This has pressured Grab to deploy vouchers and incentives, shifting the Philippines from a pure profit pool to a market requiring incremental spend to defend leadership.
In Vietnam, a market comparable in size to Thailand and the Philippines, the competitive pressure is more acute. Xanh SM overtook Grab in Q4’24, reaching ~37% market share versus Grab’s ~36%. Its gains have been attributed to service quality, coverage, and customer satisfaction, with subsequent data suggesting share expansion to ~45% by Q2’25. This is notable given Vietnam’s ride-hailing market is expected to grow at a ~22.7% CAGR from 2025–2030, making leadership strategically important.
Overall, Grab’s ride-hailing position remains strong and supports a path toward profitable growth. That said, emerging competitors and regulatory shifts mean this is not a “win-and-forget” market. Sustained execution and selective reinvestment will be required to maintain leadership.
The Game-Changer: The Grab + GoTo Merger
Reports indicate a merger is actively being discussed with the support of the Indonesian government. To avoid a monopoly crackdown, the proposal likely involves a “Golden Share” held by the state (via the Danantara fund), giving the government veto power over pricing.
If completed, this eliminates Grab’s only major competitor in its largest market (Indonesia), effectively granting it significant pricing power and removing the need for costly incentives given the combined market share of over 91%.
Digital Financial Services
The primary competitor in fintech for the region is SeaMoney, which dominates the digital banking landscape. As of Q3’25, SeaMoney reported a $6.9bn loan book (on balance sheet), up from $4.2bn in Q4’24, making it materially larger than GrabFin, which grew its loan book to $821m in Q3’25 from $536m in Q4’24. SeaMoney is therefore not only larger in absolute terms, but also growing faster.
Grab has a target of reaching a $1bn loan book by year-end, which would still represent ~87% growth versus 2024.
Looking at monetisation, SeaMoney generates a higher revenue-to-loan ratio. On an annualised basis, SeaMoney’s ratio is approximately ~50% (Q3’25 revenue × 4 divided by the Q3’25 loan book), compared to ~44% for Grab, indicating stronger conversion of loan balances into revenue. A year ago, these ratios stood at ~53% for SeaMoney and ~51% for Grab, showing that SeaMoney maintains a slightly higher yield profile. Supported by both higher yields and faster loan book expansion, SeaMoney delivered 61% revenue growth in Q3’25 (70% in Q2’25), versus 39% for Grab (41% in Q2’25) suggesting that Grab currently lags SeaMoney.
In terms of profitability, SeaMoney is already profitable at the adjusted EBITDA level, delivering margins of 26% in Q3’25, 29% in Q2’25, and 30% in Q1’25 (the drop likely reflects aggressive loan book growth to defend against Grab). In contrast, GrabFin remains loss-making, with an adjusted EBITDA margin of -31%, highlighting meaningful operating leverage potential as the loan book scales.
For context, SeaMoney reached adjusted EBITDA profitability in Q4’22, at which point its loan book stood at ~$2.1bn, more than 2× Grab’s current scale.
With Grab’s management guiding toward segment-level adjusted breakeven in H2’26, a significant expansion in the loan book appears necessary. This does not imply that Grab must exactly double its loan book to ~$2.1bn to break even, but it does suggest that breakeven is unlikely to be achieved without material further scale.
A word on GoTo: For additional context, the digital finance arm of GoTo Group delivered 55% revenue growth in Q3’25 (76% in Q2’25). GoTo also reported an adjusted EBITDA margin of 8.8% in Q3’25 and reached profitability earlier, in Q4’24, with a consumer loan book of roughly $310m (now expanded to ~$453m), implying a stronger operating efficiency relative to Grab.
That said, investors should be mindful of the structural differences in the business model. GoTo Financial achieves profitability through an asset-light, channeling model, effectively operating as a high-margin credit broker rather than a balance-sheet lender. By routing ~70–75% of its loan book off-balance sheet to strategic partners such as Bank Jago, GoTo earns upfront platform fees without bearing the capital intensity or credit loss provisions that currently weigh on Grab’s more asset-heavy digital banking strategy.
This model enables GoTo to monetise user data with near-pure margin revenue today, but it comes with a trade-off: unlike Grab, which retains full control over credit underwriting and balance-sheet economics, GoTo’s fintech growth remains dependent on the liquidity availability and risk appetite of its banking partners.
That’s a wrap. If you found this helpful, feel free to share it, so more investors can see the work.